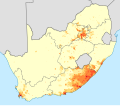
Category:Linguistic maps of South Africa
Appearance
Countries of Africa: Algeria · Angola · Benin · Burkina Faso · Cameroon · Central African Republic · Chad · Democratic Republic of the Congo · Republic of the Congo · Equatorial Guinea · Eritrea · Ethiopia · Gabon · The Gambia · Ghana · Guinea · Ivory Coast · Kenya · Libya · Malawi · Mali · Morocco · Namibia · Niger · Nigeria · Senegal · South Africa · Sudan · Tanzania · Togo · Tunisia · Uganda · Zambia · Zimbabwe
Limited recognition: Ambazonia
Limited recognition: Ambazonia
Subcategories
This category has the following 2 subcategories, out of 2 total.
Media in category "Linguistic maps of South Africa"
The following 38 files are in this category, out of 38 total.
-
Afrikaans, Dutch and multilingual areas.svg 1,238 × 974; 383 KB
-
Cape Independence, language, voting patterns and ethnicity.svg 686 × 599; 3.68 MB
-
Cape Town 2011 dominant language map.svg 771 × 1,140; 299 KB
-
Languages of South Africa by Magisterial District, 2001.png 3,032 × 2,696; 248 KB
-
Nizozemskijezik.jpg 1,238 × 974; 172 KB
-
Nizozemskijezik.svg 1,238 × 974; 562 KB
-
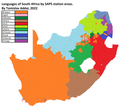
SAPS language.png 4,073 × 3,785; 579 KB
-
South Africa - Provincial Majority Languages.png 2,000 × 1,744; 88 KB
-
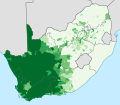
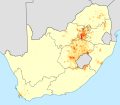
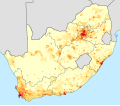
South Africa 2011 Afrikaans speakers density map.svg 809 × 709; 1.4 MB
-
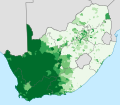
South Africa 2011 Afrikaans speakers proportion map.svg 809 × 709; 892 KB
-
South Africa 2011 dominant language map (hex cells).svg 807 × 711; 922 KB
-
South Africa 2011 dominant language map.svg 809 × 709; 798 KB
-
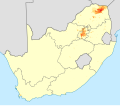
South Africa 2011 Ndebele speakers density map.svg 809 × 709; 905 KB
-
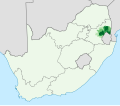
South Africa 2011 Ndebele speakers proportion map.svg 809 × 709; 337 KB
-
South Africa 2011 Nguni speakers density map.svg 809 × 709; 1.63 MB
-
South Africa 2011 Nguni speakers proportion map.svg 809 × 709; 811 KB
-
South Africa 2011 Northern Sotho speakers density map.svg 809 × 709; 870 KB
-
South Africa 2011 Northern Sotho speakers proportion map.svg 809 × 709; 438 KB
-
South Africa 2011 Sotho speakers density map.svg 809 × 709; 1.1 MB
-
South Africa 2011 Sotho speakers proportion map.svg 809 × 709; 501 KB
-
South Africa 2011 Sotho-Tswana speakers density map.svg 809 × 709; 1.44 MB
-
South Africa 2011 Sotho-Tswana speakers proportion map.svg 809 × 709; 816 KB
-
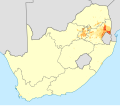
South Africa 2011 Swazi speakers density map.svg 809 × 709; 679 KB
-
South Africa 2011 Swazi speakers proportion map.svg 809 × 709; 347 KB
-
South Africa 2011 Tsonga speakers density map.svg 809 × 709; 821 KB
-
South Africa 2011 Tsonga speakers proportion map.svg 809 × 709; 388 KB
-
South Africa 2011 Tswana speakers density map.svg 809 × 709; 1.01 MB
-
South Africa 2011 Tswana speakers proportion map.svg 809 × 709; 543 KB
-
South Africa 2011 Venda speakers density map.svg 809 × 709; 647 KB
-
South Africa 2011 Venda speakers proportion map.svg 809 × 709; 347 KB
-
South Africa 2011 West Germanic speakers density map.svg 809 × 709; 1.73 MB
-
South Africa 2011 West Germanic speakers proportion map.svg 809 × 709; 1.03 MB
-
South Africa 2011 Xhosa speakers density map.svg 809 × 709; 1.25 MB
-
South Africa 2011 Xhosa speakers proportion map.svg 809 × 709; 571 KB
-
South Africa 2011 Zulu speakers density map.svg 809 × 709; 1.18 MB
-
South Africa 2011 Zulu speakers proportion map.svg 809 × 709; 534 KB
-
South Africa 2016 majority language by municipality.svg 809 × 709; 358 KB
-
South African municipalities by language.svg 809 × 709; 1.81 MB


