Category:Global warming graphs
Jump to navigation
Jump to search
Subcategories
This category has the following 8 subcategories, out of 8 total.
C
- Carbon budget (20 F)
E
- ENSO-index (19 F)
- Evidence CO2 (13 F)
F
H
- Hockey stick temperature graph (109 F)
K
- Keeling Curves (64 F)
U
Media in category "Global warming graphs"
The following 200 files are in this category, out of 830 total.
(previous page) (next page)-
1850- Warming stripes - global average surface temperature.svg 1,200 × 675; 10 KB
-
1880- Global average sea level rise (SLR) - annually mk.svg 1,200 × 675; 6 KB
-
1880- Global average sea level rise (SLR) - annually.svg 1,200 × 675; 6 KB
-
1880- Global warming by latitude zone - NASA - GISS data.webm 47 s, 1,920 × 1,080; 9.64 MB
-
1880- Global warming climate spiral - NASA GISTEMP.webm 1 min 10 s, 1,080 × 1,080; 8 MB
-
1895- Temperature change in the United States - Ed Hawkins - climate change.jpg 4,536 × 2,551; 267 KB
-
1920s -- Record high and low temperatures - U.S. - Climate Central.svg 1,040 × 750; 4 KB
-
1940- August global average temperature changes.svg 1,200 × 675; 5 KB
-
1940- July global average temperature changes.svg 1,200 × 675; 5 KB
-
1940- June global average temperature changes.svg 1,200 × 675; 5 KB
-
1940- October global average temperature changes.svg 1,200 × 675; 5 KB
-
1940- September global average temperature changes.svg 1,200 × 675; 5 KB
-
1940-2023 Global surface temperature - stacked - Copernicus.jpg 3,060 × 1,980; 381 KB
-
1950- Ozone in upper and lower troposphere.svg 1,000 × 750; 3 KB
-
1951+ Percent of global area at temperature records - Seasonal comparison - NOAA.svg 2,000 × 1,400; 22 KB
-
1951- Percent of record temperatures that are cold or warm records.svg 1,000 × 700; 8 KB
-
1951- Warm and cold record temperatures - bar chart.svg 1,000 × 700; 6 KB
-
1960- Heat wave indicators - US.svg 1,200 × 675; 2 KB
-
1991 IPCC sea level rise estimate and observation.png 800 × 500; 19 KB
-
1994- Global average temperature during June-July-August.svg 1,000 × 750; 2 KB
-
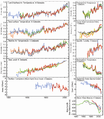
2,000- and 139-year global average temperature.png 2,750 × 4,530; 547 KB
-
2010- Cost of renewable energy - IRENA.svg 1,000 × 750; 8 KB
-
20160411 Global warming line chart (1850-2016) - Ed Hawkins.png 1,747 × 1,122; 301 KB
-
2017 Global warming attribution - based on NCA4 Fig 3.3 - single-panel version.png 3,000 × 2,250; 241 KB
-
2017 Global warming attribution - based on NCA4 Fig 3.3-de.svg 4,339 × 5,698; 754 KB
-
2017 Global warming attribution - based on NCA4 Fig 3.3.png 3,193 × 4,500; 260 KB
-
20190731 Central England Temperature (CET) (annual mean, beginning in 1659).png 3,323 × 1,351; 136 KB
-
20191021 Temperature from 20,000 to 10,000 years ago - recovery from ice age.png 2,572 × 1,948; 91 KB
-
2020 Pew Survey - Global warming - Climate change - political party.svg 1,000 × 750; 4 KB
-
20200107 "Global warming" vs "Climate change" Google search term ratio.png 2,215 × 1,674; 98 KB
-
20200112 "Climate crisis" vs "Climate emergency" - Google search term usage.png 2,322 × 1,585; 149 KB
-
20200314 Temperature changes for three latitude bands (5MA, 1880- ) GISS.svg 1,000 × 643; 72 KB
-
20200320 ~140 and ~2000 year global average temperature charts (full speed).webm 12 s, 1,920 × 1,372; 1.54 MB
-
20210822 Global warming - warming stripes bar chart.svg 1,000 × 750; 14 KB
-
202303 Global warming caused by human activities - Gallup survey.svg 1,000 × 750; 5 KB
-
202303 I worry "a great deal" about climate change - Gallup survey.svg 1,000 × 750; 5 KB
-
20231114 Attribution of global warming to climate drivers- NCA5 Fig. 3.1.c.jpg 1,370 × 1,054; 154 KB
-
20240311 Warming stripes BEHIND line chart - global surface temperature.svg 1,200 × 675; 18 KB
-
20240625 Global warming across generations - warming stripes.svg 1,200 × 1,090; 20 KB
-
595px-Atmospheric TransmissionPL.png 595 × 600; 97 KB
-
65 milions d'anys de canvi climàtic.png 712 × 464; 20 KB
-
65 MJ Klima Änderungen.png 650 × 397; 35 KB
-
65 Myr Climate Change croppedIT.png 546 × 392; 38 KB
-
65 Myr Climate Change Full.png 651 × 397; 21 KB
-
65 Myr Climate Change-es-MTPE.svg 650 × 397; 44 KB
-
65 Myr Climate Change-es.svg 650 × 397; 42 KB
-
65 Myr Climate Change.png 650 × 397; 21 KB
-
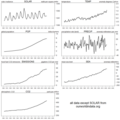
7 world series from our world in data.png 1,116 × 1,115; 81 KB
-
800,000-, 2,000-, 139-year global average temperature.png 3,000 × 7,000; 2.31 MB
-
Aktywność słoneczna.png 700 × 466; 30 KB
-
All palaeotemps G2.svg 1,760 × 513; 147 KB
-
All palaeotemps-de.svg 1,002 × 293; 392 KB
-
Amoc-index.svg 1,000 × 500; 129 KB
-
Andrews2012a.JPG 465 × 581; 51 KB
-
Annual Arctic Sea Ice Minimum.jpg 3,840 × 2,160; 539 KB
-
Annual CO₂ emissions in 2016 vs. 1990, OWID.svg 850 × 600; 41 KB
-
Annual greenhouse gas index (1980-2017)-ar.png 2,034 × 1,443; 166 KB
-
Annual greenhouse gas index (1980-2017).png 2,034 × 1,443; 80 KB
-
Annual Mean Temperature Change for Land and for Ocean NASA GISTEMP 2017 October.png 1,500 × 1,235; 297 KB
-
Annual total CO₂ emissions, by world region.png 3,400 × 2,400; 531 KB
-
Annual world greenhouse gas emissions, in 2005, by sector.png 1,040 × 980; 29 KB
-
Annual world greenhouse gas emissions, in 2005, by sector.svg 1,222 × 1,150; 23 KB
-
Anomaly.png 1,224 × 835; 57 KB
-
Antarctic-sea-ice-extent 2016-2023.jpg 1,240 × 640; 135 KB
-
Anthropogenic global warming hijacked natural climate change.jpg 960 × 518; 158 KB
-
ANTHROPOGENIC HEAT. 2009.jpg 374 × 398; 44 KB
-
ANTHROPOGENIC HEAT.1980-2010.png 1,200 × 400; 32 KB
-
Ar4 forcings.jpg 923 × 649; 59 KB
-
Ar5 aerosols ru.jpg 911 × 744; 120 KB
-
Atmospheric Circulation effect of an expanding tropics.png 4,096 × 5,321; 1.47 MB
-
Atmospheric CO2 3Dspiral since1958.png 1,140 × 1,110; 72 KB
-
Atmospheric Transmission de.png 850 × 860; 73 KB
-
Atmospheric Transmission JA.png 850 × 857; 100 KB
-
Atmospheric Transmission-ar.png 850 × 857; 138 KB
-
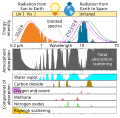
Atmospheric Transmission-en.svg 741 × 724; 146 KB
-
Atmospheric Transmission-ko.svg 741 × 724; 160 KB
-
Atmospheric Transmission-mk.svg 741 × 724; 326 KB
-
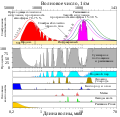
Atmospheric Transmission-ru.svg 741 × 724; 155 KB
-
Atmospheric Transmission.png 850 × 857; 75 KB
-
Atmospheric Transmission.svg 741 × 724; 321 KB
-
Austria-TAVG-Trend.svg 1,024 × 640; 466 KB
-
Average Global Temps 1880-2016 NASA GISS.png 1,280 × 720; 65 KB
-
Bau future warming med.jpg 500 × 375; 26 KB
-
Beijing average annual temperatures 1970 to 2019.jpg 2,400 × 1,200; 319 KB
-
Beiträge zur globalen Erwärmung 1951–2010.svg 512 × 512; 3 KB
-
Belgium Temp (1750-2013)BE.jpg 2,374 × 1,812; 1.06 MB
-
Burn locally.jpg 512 × 406; 126 KB
-
Burn locally.tiff 512 × 406; 145 KB
-
BurningEmbers-2001-2009-20013.svg 1,803 × 866; 139 KB
-
CAIRNS on global climat changes.gif 620 × 400; 17 KB
-
Cambio climático.png 600 × 582; 181 KB
-
Carbon Dioxide 400kyr ja.png 600 × 436; 25 KB
-
Carbon Dioxide 400kyr-fi.png 600 × 436; 26 KB
-
Carbon Dioxide 400kyr-nl.png 600 × 436; 17 KB
-
Carbon Dioxide 400kyr.png 600 × 436; 26 KB
-
Carbon Dioxide 800kyr mk.svg 535 × 361; 128 KB
-
Carbon Dioxide 800kyr-nl.svg 502 × 339; 64 KB
-
Carbon Dioxide 800kyr-vi.svg 502 × 339; 50 KB
-
Carbon Dioxide 800kyr.svg 535 × 361; 55 KB
-
Carbon Emis by Region.es.jpg 551 × 402; 30 KB
-
Carbon Emission by JiHong.png 551 × 402; 45 KB
-
Carbon Emission by Region (zh).png 551 × 402; 20 KB
-
Carbon Emission by Region ja.png 551 × 402; 24 KB
-
Carbon Emission by Region.png 551 × 402; 28 KB
-
Carbon emission intensity of economies, OWID.svg 850 × 600; 5 KB
-
Carbon emission intensity vs GDP per capita, OWID.svg 850 × 600; 44 KB
-
Carbon emission intensity, OWID.svg 850 × 600; 27 KB
-
Carbon emissions by region en.svg 575 × 407; 30 KB
-
Carbon History and Flux Rev.png 642 × 800; 32 KB
-
Carbon History and Flux.png 477 × 600; 23 KB
-
Carbon14 with activity labels-fr.svg 865 × 275; 12 KB
-
CarbonEmissionsAndGDP.png 976 × 637; 32 KB
-
CERES Earth Heat Content Anomaly.jpg 1,024 × 576; 70 KB
-
CET 1659 - 2014 using Hadley Centre Data.png 696 × 473; 69 KB
-
CFC gases.jpg 689 × 287; 19 KB
-
Change in total heat content of earth.svg 640 × 480; 28 KB
-
Changes in climate indicators that show global warming.png 2,100 × 3,242; 1.39 MB
-
Changes in total solar irradiance and monthly sunspot numbers, 1975-2013 NO.png 2,318 × 1,746; 314 KB
-
Changes in total solar irradiance and monthly sunspot numbers, 1975-2013-da.png 2,318 × 1,746; 303 KB
-
Changes in total solar irradiance and monthly sunspot numbers, 1975-2013-es.png 2,318 × 1,746; 217 KB
-
Changes in total solar irradiance and monthly sunspot numbers, 1975-2013.png 2,318 × 1,746; 289 KB
-
Climate Change Attribution fr.png 799 × 588; 86 KB
-
Climate Change Attribution German.png 500 × 573; 32 KB
-
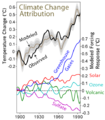
Climate Change Attribution.png 500 × 573; 28 KB
-
Climate change numbered.svg 512 × 497; 237 KB
-
Climate change unlabeled.svg 512 × 497; 236 KB
-
Climate change-en.svg 512 × 497; 240 KB
-
Climate change-es.svg 512 × 497; 286 KB
-
Climate change-fr.svg 512 × 497; 238 KB
-
Climate science opinion graph 3 Sans.svg 512 × 357; 7 KB
-
Climate science opinion graph 3.svg 512 × 357; 17 KB
-
Climate science opinion graph 3Path.svg 512 × 357; 199 KB
-
Climate science opinion2.png 810 × 606; 140 KB
-
Climate.Indicators.0.5.MYr-1-ru.svg 733 × 648; 11 KB
-
Climate.Indicators.0.5.MYr-1.jpg 952 × 839; 93 KB
-
ClimateDashboard-Antarctic-sea-ice-summer-minimum-graph-20230307-1400px.jpg 1,400 × 1,200; 252 KB
-
ClimateDashboard-global-sea-levels-graph-20230329-1400px.png 1,400 × 1,200; 88 KB
-
Co2 1990,2012 (Polish description).png 1,000 × 1,324; 83 KB
-
Co2 by country.png 745 × 1,118; 55 KB
-
CO2 emission per capita.jpg 1,131 × 761; 116 KB
-
Co2 sketch.png 663 × 411; 6 KB
-
CO2 total par région.svg 960 × 682; 59 KB
-
CO2 vs CH4 vs delta-T for WAIS ice cores.svg 1,352 × 746; 268 KB
-
CO2-by-country--1990-2025.jpg 902 × 615; 73 KB
-
CO2-Temp.png 1,200 × 644; 22 KB


