Category:Climatological diagrams
Jump to navigation
Jump to search
See also Category:Weather and climate maps
Subcategories
This category has the following 21 subcategories, out of 21 total.
Pages in category "Climatological diagrams"
This category contains only the following page.
Media in category "Climatological diagrams"
The following 200 files are in this category, out of 395 total.
(previous page) (next page)-
Ocean Heat Content (2012).png 569 × 380; 32 KB
-
0Master Past 20000yrs temperatures icecore Vostok 150dpi.png 1,664 × 1,076; 63 KB
-
2012 Arctic Ice Extent-aug25.png 1,050 × 840; 456 KB
-
420.000 Jahre Klimadaten im Vergleich zu Milanković-Zyklen.png 1,997 × 1,445; 513 KB
-
4600 Myr climate change.svg 1,260 × 341; 77 KB
-
4jahreszeiten schrift meuropa.jpg 1,603 × 895; 122 KB
-
57911main Earth Energy Budget.jpg 450 × 336; 59 KB
-
65 milions d'anys de canvi climàtic.png 712 × 464; 20 KB
-
65 Myr Climate Change Chinese Version.gif 650 × 397; 30 KB
-
65 Myr Climate Change croppedIT.png 546 × 392; 38 KB
-
65 Myr Climate Change Full.png 651 × 397; 21 KB
-
65 Myr Climate Change-es-MTPE.svg 650 × 397; 44 KB
-
65 Myr Climate Change-es.svg 650 × 397; 42 KB
-
65 Myr Climate Change.png 650 × 397; 21 KB
-
8200kyr event1.jpg 671 × 791; 117 KB
-
Absorptions-pressure.png 1,123 × 793; 10 KB
-
Aerosol dimming.jpg 500 × 207; 11 KB
-
AGOw1 en.jpg 645 × 734; 322 KB
-
Albedo bn.svg 1,588 × 2,220; 227 KB
-
Albedo-d hg.png 1,622 × 2,324; 93 KB
-
Albedo-e hg af.svg 1,588 × 2,220; 28 KB
-
Albedo-e hg.png 1,588 × 2,220; 64 KB
-
Albedo-e hg.svg 1,588 × 2,220; 25 KB
-
Alberta-chinook.png 262 × 448; 31 KB
-
Aldebo povrchů.svg 1,588 × 2,220; 8 KB
-
Alt gmsl seas not rem.jpg 700 × 500; 142 KB
-
Alt gmsl seas rem.jpg 700 × 500; 136 KB
-
Amo timeseries 1895-2008.svg 876 × 638; 776 KB
-
Antarctic extent 1978-2007.png 504 × 360; 16 KB
-
Antarctic sea ice extent 6 July 2014.png 1,050 × 840; 251 KB
-
AOindex monthlymean CPC.gif 600 × 800; 60 KB
-
Arakawa grids.svg 500 × 320; 24 KB
-
Arctic Extent 1978-2007.png 504 × 360; 13 KB
-
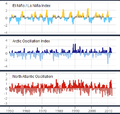
Arctic Oscillation.png 2,102 × 4,424; 2.86 MB
-
Arctique plus Antarctique étendue globale glace 2016 et la moyenne de 1981 à 2010.png 1,950 × 1,350; 172 KB
-
ATM Oxygen Content fi.svg 744 × 524; 40 KB
-
Atmos-circ-jja.png 800 × 1,000; 30 KB
-
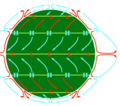
AtmosphCircNT.png 300 × 264; 45 KB
-
Atmosphere swe.svg 2,480 × 3,508; 29 KB
-
Atmosphere-p-T.png 993 × 574; 99 KB
-
Atmospheric CO2 with glaciers cycles.png 939 × 680; 41 KB
-
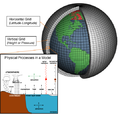
AtmosphericModelSchematic.png 540 × 512; 200 KB
-
Aufgliederung der einstrahlenden Sonnenenergie.svg 512 × 371; 12 KB
-
Average monthly Insolation to 15 deg N S.jpg 1,226 × 788; 151 KB
-
Balance hídirco.png 353 × 474; 5 KB
-
BilancioGeostrofico.png 539 × 405; 8 KB
-
Breakdown of the incoming solar energy.svg 853 × 619; 17 KB
-
Brine salinity.gif 1,350 × 975; 10 KB
-
Brine volume.gif 1,350 × 975; 14 KB
-
Carbon exchange reservoir 2 Japanese.svg 620 × 525; 63 KB
-
Carbon exchange reservoir 2.svg 620 × 525; 138 KB
-
CASILDA T 1931 1960.png 650 × 435; 29 KB
-
CDM Baseline 2..JPG 991 × 461; 53 KB
-
CET full span year mean.PNG 973 × 600; 25 KB
-
CET Full Temperature Yearly.png 977 × 600; 34 KB
-
Changes in temperature Chinese holocene.PNG 1,352 × 727; 37 KB
-
Chart of CO2 concentration in atmosphere 1960-2012.png 792 × 612; 329 KB
-
Châtelperronien.png 520 × 746; 23 KB
-
Ciclo CDM.JPG 984 × 611; 75 KB
-
Circulation de Walker.png 590 × 413; 18 KB
-
Circulation El Nino-(el).PNG 606 × 413; 19 KB
-
Circulation El Nino.png 608 × 413; 16 KB
-
Circulation La Nina-(el).PNG 606 × 413; 19 KB
-
Circulation La Nina.png 606 × 413; 17 KB
-
ENSO - El Niño-cs.svg 512 × 394; 22 KB
-
ENSO - El Niño.svg 512 × 394; 21 KB
-
ENSO - La Niña-cs.svg 240 × 185; 22 KB
-
ENSO - La Niña.svg 240 × 185; 21 KB
-
ENSO - normal-cs.svg 370 × 285; 23 KB
-
ENSO - normal.svg 370 × 285; 22 KB
-
Enso elnino.png 608 × 413; 17 KB
-
Enso lanina.png 606 × 413; 18 KB
-
Enso normal-el.PNG 606 × 413; 20 KB
-
Enso normal.png 590 × 413; 19 KB
-
Pacific Ocean ru.png 590 × 413; 19 KB
-
Climat des Grands-Lacs.png 959 × 761; 315 KB
-
Climate-change 70ma.png 1,035 × 787; 115 KB
-
Climate-data.png 600 × 400; 25 KB
-
Climate.Indicators.0.5.MYr-1-ru.svg 733 × 648; 11 KB
-
Climate.Indicators.0.5.MYr-1.jpg 952 × 839; 93 KB
-
Climatechange.png 800 × 597; 4 KB
-
Climograma de givoni argentina.png 828 × 638; 164 KB
-
Co2 glacial cycles 800k.png 818 × 580; 17 KB
-
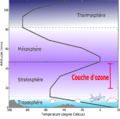
Couches de l'atmosphere.png 1,042 × 1,035; 234 KB
-
Cretaceous delta O-18 isotopic ratio.PNG 960 × 720; 33 KB
-
Croquis circulation atmosphériqueChili.jpg 816 × 533; 273 KB
-
Curva-isotopica.jpg 501 × 285; 31 KB
-
Definitions MCA.svg 1,676 × 753; 64 KB
-
Denekamp.png 522 × 780; 25 KB
-
Diagramme climatique d'Horsham.png 2,336 × 1,266; 73 KB
-
Dij 02.jpg 3,489 × 2,208; 512 KB
-
Dinolrg.png 614 × 442; 65 KB
-
Discretization for the different Arakawa grids correct.svg 535 × 343; 30 KB
-
Discretization for the different Arakawa grids.svg 502 × 322; 18 KB
-
Dióxido de carbono no Neoarqueano.png 1,365 × 629; 684 KB
-
Dryas ngrip2.jpg 800 × 700; 113 KB
-
EB1911 - Climate Fig. 11.—Annual March of Temperature, Temperate.jpg 250 × 715; 46 KB
-
EB1911 - Climate Fig. 12.—Annual March of Rainfall, Temperate.jpg 300 × 322; 28 KB
-
EB1911 - Climate Fig. 13.—Annual March of Cloudiness, Temperate.jpg 300 × 165; 22 KB
-
EB1911 - Climate Fig. 14.—Annual March of Cloudiness, Polar.jpg 308 × 171; 21 KB
-
EB1911 - Climate Fig. 3.—Annual March of Air Temperature.jpg 345 × 600; 44 KB
-
EB1911 - Climate Fig. 4.—Annual march of temperature.jpg 400 × 385; 39 KB
-
EB1911 - Climate Fig. 5.—Annual march of rainfall.jpg 250 × 457; 25 KB
-
EB1911 - Climate Fig. 6.—Annual march of cloudiness.jpg 350 × 193; 15 KB
-
EB1911 - Climate Fig. 7.—Annual march of temperature.jpg 260 × 578; 80 KB
-
EB1911 - Climate Fig. 8.—Annual March of Rainfall, Sub-tropics.jpg 350 × 239; 18 KB
-
Ecinfigtwo.jpg 943 × 410; 52 KB
-
EDC TempCO2Dust.svg 886 × 709; 572 KB
-
ENSO - El Niño-th.svg 512 × 394; 24 KB
-
ENSO - La Niña-th.svg 240 × 185; 24 KB
-
ENSO - normal-th.svg 370 × 285; 25 KB
-
Epica 18 plot.png 596 × 417; 11 KB
-
EPICA delta D plot.svg 1,024 × 768; 124 KB
-
EPICA delta D plotport.svg 1,024 × 768; 124 KB
-
Epica-vostok-grip-140kyr.png 1,169 × 373; 12 KB
-
Epica-vostok-grip-40kyr-HCO.png 769 × 333; 9 KB
-
Equilibrio energetico.svg 372 × 364; 9 KB
-
Erdgeschichte af.png 1,280 × 778; 67 KB
-
Erdgeschichte af2.svg 530 × 322; 43 KB
-
Ewtspr hadam3h n 081s4 002a 002a 0 0.png 736 × 441; 33 KB
-
Fast Feedback Climate Sensitivity.gif 440 × 381; 26 KB
-
Five Myr Climate Change (fr).svg 1,055 × 393; 47 KB
-
Five Myr Climate Change (ru).svg 1,024 × 372; 53 KB
-
Five Myr Climate Change-ml.svg 1,024 × 372; 236 KB
-
Five Myr Climate Change.png 745 × 224; 18 KB
-
Five Myr Climate Change.svg 1,024 × 372; 68 KB
-
Fjällstufenschnitt 2.png 1,221 × 822; 265 KB
-
FluxoCO2 diario.gif 572 × 416; 4 KB
-
Future heatwave-related excess deaths model Journal.pmed.1002629.g001.png 2,210 × 1,010; 452 KB
-
Félmilliárd éves hőmérsékletdiagram.jpg 726 × 461; 207 KB
-
Gases de efecto invernadero.es.png 623 × 412; 49 KB
-
Gases de efecto invernadero.png 640 × 480; 48 KB
-
Gases de efecto invernadero.svg 512 × 384; 33 KB
-
Gemtemperatuur.PNG 412 × 258; 7 KB
-
Geologic time scale Climate Change.png 1,000 × 600; 58 KB
-
Glacier advances.svg 1,000 × 500; 31 KB
-
Glacier Mass Balance German.png 658 × 500; 20 KB
-
Glacier Mass Balance Map German.png 650 × 477; 35 KB
-
Global average temperature 1997-2013.png 951 × 777; 40 KB
-
Global Climate Model.png 1,000 × 660; 509 KB
-
Global Energy Budget Diagram.png 2,500 × 1,773; 2.61 MB
-
Global.Cenozoic.Temperature-es.svg 335 × 639; 137 KB
-
Global.Cenozoic.Temperature.gif 560 × 750; 28 KB
-
Globales Profil - Höhenstufen der Vegetation.png 2,356 × 1,312; 397 KB
-
Greenhouse gas by sector 2000 de.svg 700 × 605; 42 KB
-
Greenhouse Gas by Sector-es.png 617 × 584; 77 KB
-
Greenland gisp2 alley.png 900 × 589; 92 KB
-
Greenland ice sheet temperatures Vinther et al 2009.png 2,006 × 1,129; 472 KB
-
H,x Mollier-Diagramm - extremer Sommer (TRY 7).png 1,240 × 1,755; 935 KB
-
H,x Mollier-Diagramm - extremer Winter (TRY 7-2013).png 1,240 × 1,755; 864 KB
-
H,x Mollier-Diagramm - mittleres Jahr (TRY 7).png 1,240 × 1,755; 860 KB
-
Hadcrut3 time series.png 1,000 × 800; 76 KB
-
Hatvanötmillió éves hőmérsékletdiagram.jpg 609 × 368; 118 KB
-
Hengelo.png 607 × 746; 28 KB
-
Hilo Hawai 1929-2011.gif 650 × 502; 27 KB
-
Holocene Temperature Variations.png 600 × 400; 52 KB
-
Huneborg.PNG 520 × 746; 27 KB
-
HURBANOVO-zimy.jpg 819 × 630; 241 KB
-
Ice age climate.png 940 × 482; 7 KB
-
Ice Age Temperature spanish.png 564 × 391; 25 KB
-
Ice Age Temperature-fi.png 582 × 389; 28 KB
-
Ice Age Temperature.png 564 × 377; 44 KB
-
Iceage time-slice hg.png 3,208 × 2,074; 150 KB
-
Illustration Assimilation Donnees 4.jpg 325 × 325; 22 KB
-
Influencia de las corrientes marinas rus.jpg 751 × 430; 105 KB
-
Influencia de las corrientes marinas.jpg 751 × 430; 57 KB
-
Insolacion 21junio.png 1,134 × 778; 42 KB
-
Insolacion sin atmosfera.jpg 481 × 372; 46 KB
-
Insolación superficial.jpg 485 × 369; 35 KB
-
Insolation daily mean lat by time.png 612 × 792; 53 KB
-
Isotopic stages hg.png 1,149 × 799; 109 KB
-
Jetstream - Rossby Waves - N hemisphere.svg 1,042 × 253; 7 KB
-
Jetstreamconfig.jpg 336 × 193; 29 KB
-
Jones et al. Surface air temperature.jpg 529 × 384; 30 KB
-
Kaltzeit hg.png 782 × 537; 39 KB
-
Karte mit zu erwartenden Schneehöhen Teil III T-Y.jpg 1,024 × 1,529; 819 KB
-
Kr85 Vertical Profile.svg 1,280 × 698; 6 KB
-
Kvin Ma Klimata Sango.svg 1,024 × 372; 36 KB
-
Lascaux-Interstadial.png 606 × 780; 30 KB
-
Laugerie-Interstadial.png 606 × 780; 29 KB
-
Lgm temperature curve 1.jpg 800 × 600; 183 KB
-
LuterbacherEtAl-ERL2016-fig1.jpg 1,720 × 1,331; 1,001 KB
-
Maisières.png 522 × 780; 23 KB
-
Major greenhouse gas trends German.png 640 × 480; 27 KB
-
Major greenhouse gas trends-ar.png 1,020 × 668; 111 KB
-
Major greenhouse gas trends.png 1,020 × 668; 88 KB
-
Mann hockeystick.jpg 642 × 451; 223 KB
-
Medeltemp Jorden 1.jpg 1,012 × 478; 44 KB
-
Medeltemp Jorden 2.jpg 1,014 × 462; 46 KB
-
Medidas.gif 640 × 350; 101 KB
-
Middle weichselian oxygen isotope curve 1.gif 1,600 × 766; 196 KB
-
Milankovitch Variations.png 479 × 363; 32 KB
-
Mittelmdruck.jpg 561 × 190; 55 KB
-
Modification of Whittaker Biome Map for Global Climate Space.jpg 1,736 × 1,749; 279 KB
-
Morskyvanok.jpg 640 × 300; 11 KB
-
MSA.PNG 629 × 467; 13 KB


