Category:Global warming diagrams
Jump to navigation
Jump to search
English: Note: Images in this category incorporated into the Global Warming Art project and licensed for use under either:
- The GNU Free Documentation License Version 1.2; with no Invariant Sections, Front-Cover Texts, or Back-Cover Texts.
- The Creative Commons Attribution-NonCommercial-ShareAlike License Version 2.5
Subcategories
This category has the following 9 subcategories, out of 9 total.
Media in category "Global warming diagrams"
The following 163 files are in this category, out of 163 total.
-
1 ipcc 5th report economic sector impact on environment en.svg 926 × 501; 114 KB
-
1880- Global average sea surface temperature - global warming.svg 1,200 × 900; 8 KB
-
1955- Ocean heat content - NOAA.svg 1,200 × 675; 6 KB
-
1979- Daily sea surface temperatures 60S-60N latitudes.png 2,135 × 1,397; 298 KB
-
1979- Radiative forcing - climate change - global warming - EPA NOAA.svg 1,100 × 750; 11 KB
-
1990- Annual greenhouse gas emissions - U.S. - line chart.svg 1,200 × 675; 5 KB
-
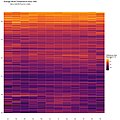
1994- Global average temperature during June-July-August.svg 1,000 × 750; 2 KB
-
2 ipcc 5th report economic sector impact on environment ptbr.svg 926 × 501; 125 KB
-
2015-2100 Impacts of global warming on glaciers and sea level rise.svg 1,200 × 800; 3 KB
-
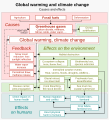
20200101 Global warming - climate change - causes effects feedback.png 3,287 × 2,106; 586 KB
-
695552659 425c1b9674 b.jpg 1,024 × 700; 533 KB
-
97% of Climate Scientists Confirm Anthroprogenic Global Warming.svg 3,010 × 2,420; 7 KB
-
AGW Causes Effects.demo.png 620 × 691; 27 KB
-
Anthropogenic changes in the global carbon cycle.png 2,067 × 1,250; 143 KB
-
Aufnahme der durch Klimawandel verursachten Wärme durch Ozeane.svg 400 × 300; 42 KB
-
Cambio climatico (build version).jpg 600 × 586; 59 KB
-
Cambio climatico (french).jpg 600 × 586; 66 KB
-
Cambio climatico.jpg 600 × 586; 82 KB
-
Carbon neutral and carbon cycle.png 1,100 × 800; 55 KB
-
Cascading global climate failure.jpg 2,024 × 2,823; 740 KB
-
Ck8gRgSWUAAKGIA.jpg 1,200 × 1,200; 210 KB
-
Climate camp Augsburg Informations 09.jpg 3,648 × 2,736; 2.88 MB
-
Climate Change.png 800 × 700; 377 KB
-
Climate Science Milestones Two Centuries.jpg 1,024 × 610; 241 KB
-
Co2 emissions worldwide in 2014 english.jpg 1,392 × 994; 69 KB
-
Co2 emissions worldwide in 2014 german.jpg 1,335 × 954; 69 KB
-
Comparison of forest, cropland and pasture,rangeland changes.webp 2,039 × 1,241; 237 KB
-
CS diagram.svg 438 × 180; 79 KB
-
Detection and attribution of climate change (NOAA NCDC).png 2,137 × 1,235; 642 KB
-
Diagram showing ten indicators of global warming cs.png 3,191 × 1,691; 1.96 MB
-
Drivhuseffekt.png 750 × 577; 53 KB
-
Efecte hivernacle.svg 750 × 577; 21 KB
-
Efecto invernadero.PNG 750 × 577; 20 KB
-
Efekt cieplarniany 01.png 750 × 577; 47 KB
-
Effet de Serre.png 794 × 611; 73 KB
-
Emission de GES.png 744 × 678; 60 KB
-
Emissions forecasts for the two largest emitters, under three scenarios.webp 1,911 × 2,092; 120 KB
-
Energy consumption by source, OWID.svg 850 × 600; 47 KB
-
Energy-related-co2-emissions-per-capita-by-income-decile-by-regions-2021.png 1,200 × 1,000; 27 KB
-
Exposure to significant harm from climate change at different levels of warming.webp 1,388 × 1,060; 73 KB
-
FR-Energie-1990-2022.svg 1,619 × 825; 204 KB
-
FR-EvolTempé.svg 1,053 × 592; 61 KB
-
FR-Financements-climat-2011-2021.svg 980 × 584; 234 KB
-
FR-GES-1900-2022.svg 2,088 × 1,078; 77 KB
-
FR-GES-1990-2019.svg 641 × 462; 105 KB
-
FR-GES-1990-2022.svg 1,282 × 924; 483 KB
-
FR-GES-Agriculture-1990-2022.svg 1,325 × 806; 204 KB
-
FR-GES-Batiments-1990-2022.svg 1,629 × 853; 236 KB
-
FR-GES-Dechets-1990-2022.svg 1,348 × 698; 190 KB
-
FR-GES-Dechets-Details-1990-2022.svg 1,054 × 512; 241 KB
-
FR-GES-Dechets-Gaz-1990-2022.svg 1,182 × 633; 334 KB
-
FR-GES-Industrie-1900-2022.svg 1,302 × 756; 219 KB
-
FR-SNBC-Transports-2010-2030.svg 1,872 × 965; 218 KB
-
FR-SNBC2-Evol-GES.PNG 1,380 × 913; 212 KB
-
FR-Transports-1990-2022.svg 1,464 × 782; 211 KB
-
Glacier Mass Balance vector-da.svg 823 × 625; 88 KB
-
Global Atmospheric Model.jpg 650 × 439; 136 KB
-
Global carbon budget components.png 2,067 × 2,597; 341 KB
-
Global carbon cycle.png 2,067 × 1,253; 126 KB
-
Global GHG Emissions by Sector 2016.png 1,740 × 1,305; 231 KB
-
Global Methane Budget 2017.jpg 1,725 × 1,036; 515 KB
-
Global Nitrous Oxide Budget 2020.png 1,699 × 1,111; 193 KB
-
Global temp.png 800 × 571; 71 KB
-
Global Warming Predictions-da.png 528 × 377; 22 KB
-
Globale erwärmung.svg 480 × 346; 136 KB
-
Globales N2O Budget.png 1,699 × 1,111; 265 KB
-
Globales N2O Budget.svg 800 × 450; 576 KB
-
Globaljjaanoms gis 2023 chart lrg.jpg 3,078 × 1,389; 392 KB
-
Gore inconvenient truth loops.gif 772 × 609; 21 KB
-
Gore inconvenient truth loops.png 1,333 × 839; 56 KB
-
Greenhouse Effect eu.png 1,628 × 1,212; 43 KB
-
Greenhouse Effect ja.png 750 × 577; 22 KB
-
Greenhouse Effect vn.png 750 × 577; 62 KB
-
Greenhouse Effect-fi.png 750 × 577; 46 KB
-
Greenhouse Effect.png 750 × 577; 28 KB
-
Greenhouse gas by sector 2000 de.svg 700 × 605; 42 KB
-
Greenhouse gas by sector 2000.svg 650 × 603; 9 KB
-
Greenhouse Gas by Sector sv.png 650 × 603; 32 KB
-
Greenhouse Gas by Sector-es.png 617 × 584; 77 KB
-
Greenhouse Gas by Sector.png 1,632 × 1,632; 366 KB
-
Greenhouse gas summary.PNG 1,762 × 1,254; 39 KB
-
Human fingerprints for global warming.jpg 1,024 × 768; 164 KB
-
Ilmaston keikahduspisteet.svg 600 × 371; 426 KB
-
Ipcc 2014 01.svg 600 × 400; 9 KB
-
Ipcc 2014 02-tr.png 752 × 452; 62 KB
-
Ipcc 2014 02.png 1,200 × 800; 90 KB
-
Ipcc 2014 bar graph.png 698 × 661; 26 KB
-
IPCC AR6 WGI SPM obr1.svg 660 × 341; 218 KB
-
Karte Wie die Ozeane CO2 speichern.svg 800 × 450; 1.82 MB
-
KAS-Klimakatastrophe-Bild-13259-1.jpg 783 × 1,109; 121 KB
-
Larsen B Collapse Size Comparison.png 540 × 498; 520 KB
-
ManpolloGrid.png 465 × 465; 39 KB
-
McCarty Glacier.jpg 996 × 704; 113 KB
-
Methane emissions for 2017 by region, source category, and latitude.jpg 1,720 × 760; 456 KB
-
MethaneInfographicGlobalCarbonProject2016ccBySa de.png 2,000 × 1,200; 297 KB
-
MethaneInfographicGlobalCarbonProject2016ccBySa.png 2,000 × 1,200; 199 KB
-
Monthly-surface-temperature-anomalies-by-year.png 3,400 × 2,400; 2.2 MB
-
Okonos-GlobalWarm.jpg 4,032 × 3,024; 5.44 MB
-
Overall GHG from Transport.png 4,268 × 4,267; 1.85 MB
-
Overlap between future population distribution and extreme heat.jpg 4,387 × 1,814; 1.97 MB
-
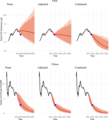
Probabilistic global temperature forecast and validation.webp 1,922 × 717; 46 KB
-
Projected global warming in 2100 for a range of emission scenarios (ru).png 1,200 × 800; 57 KB
-
SC diagramme.svg 438 × 180; 94 KB
-
Schematic climate sensitivity.svg 445 × 299; 36 KB
-
Schéma des interconnexions des adaptations à la montée des eaux.png 1,625 × 817; 119 KB
-
Sklenikove plyny po sektorech 2000.svg 650 × 603; 15 KB
-
Slow Reveal Graphs- Climate Spiral (SVS5383 - GISTEMP Spiral SR 6 01800 print).jpg 1,024 × 1,024; 166 KB
-
Slow Reveal Graphs- Climate Spiral (SVS5383).png 2,160 × 1,080; 1.46 MB
-
SNBC2.svg 817 × 470; 70 KB
-
Surface average atmospheric CO2 concentration (ppm) over time.png 2,067 × 1,316; 115 KB
-
Temperature trends in different layers of the Southern Ocean.jpg 1,500 × 1,196; 662 KB
-
Temperature-anomaly.png 3,400 × 2,400; 818 KB
-
The 2011–2022 decadal mean components of the global carbon budget.png 2,067 × 1,447; 547 KB
-
The Global Methane Budget 2008–2017.png 2,778 × 1,667; 148 KB
-
The methane climate feedback loop for natural ecosystems.jpg 2,273 × 1,786; 295 KB
-
This image demonstrates the rising temperatures in Earth's atmosphere.jpg 1,280 × 720; 626 KB
-
Timeline TwoCenturies part3 hiRes DE korrigiert.jpg 1,500 × 843; 825 KB
-
Timeline TwoCenturies part3 hiRes DE.jpg 1,500 × 843; 665 KB
-
U.S. Temperature Climate Normals.png 1,179 × 501; 603 KB
-
Van der Wiel ru.jpg 1,279 × 699; 219 KB
-
Von stork Q57.png 830 × 700; 60 KB
-
WhereIsTheHeatOfGlobalWarming-da.svg 1,165 × 793; 17 KB
-
Zwei Jahrhunderte Teil1.jpg 1,500 × 735; 506 KB
-
ZweiJahrhunderte Teil2.jpg 1,500 × 765; 628 KB
-
Ökologische Belastungsgrenzen 2015.png 1,929 × 1,989; 379 KB
-
Одступање средње годишње глобалне температуре.jpg 960 × 876; 78 KB
-
Средња годишња глобална температура.jpg 960 × 877; 74 KB
-
世界の総人口と年平均気温.png 2,433 × 1,704; 166 KB
-
世界平均放射強制力.png 1,354 × 1,354; 103 KB
-
全球放射強制力2020.png 729 × 937; 50 KB
-
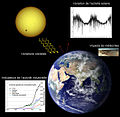
太陽活動と気温の変化.png 1,080 × 859; 95 KB
-
日本の気温差・海水温差の推移.png 2,190 × 1,558; 163 KB
-
近年の二酸化炭素と気温の変化.png 664 × 586; 59 KB


