Category:Economic statistics
Jump to navigation
Jump to search
English: Economic statistics
topic of applied statistics | |||||
| Upload media | |||||
| Subclass of | |||||
|---|---|---|---|---|---|
| |||||
Subcategories
This category has the following 27 subcategories, out of 27 total.
*
B
- Bankruptcy statistics (11 F)
D
E
F
G
H
I
M
- Money supply (90 F)
O
- Occupation charts (153 F)
- Okun's law charts (12 F)
P
- Productivity graphs (23 F)
S
T
W
Media in category "Economic statistics"
The following 200 files are in this category, out of 435 total.
(previous page) (next page)-
2005thaigpp.PNG 452 × 1,543; 93 KB
-
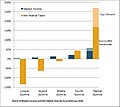
2007 Combined income of returns per income bracket.png 1,024 × 300; 6 KB
-
2007 Combined income of returns per income bracket.svg 936 × 145; 36 KB
-
2007 income statistics c.png 6,500 × 900; 30 KB
-
2007 Returns per income bracket.png 3,600 × 300; 8 KB
-
2009 Output Gap IMF.png 938 × 771; 16 KB
-
36-37.jpg 1,811 × 1,102; 207 KB
-
A&CEconomicStats.jpg 739 × 465; 180 KB
-
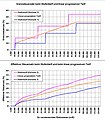
AdjustedWageShareUSAFRGJapan.PNG 978 × 632; 38 KB
-
Ag annual average USD price 1792-2005.png 640 × 480; 3 KB
-
All.svg 512 × 410; 26 KB
-
American affluence.svg 400 × 330; 12 KB
-
Annual Export to 2008.jpg 962 × 580; 190 KB
-
Annual Gross World Product Growth 1,000,000-2011 DeLong.png 1,576 × 560; 19 KB
-
Anzahl Kundinnen und Kunden bei Galaxus und Digitec.jpg 626 × 485; 64 KB
-
Arbeitsproduktivität im Vergleich zu USA 2004.png 970 × 604; 38 KB
-
ArbProdVerglUSABRD.PNG 970 × 604; 39 KB
-
Australian Household Finances - Debt and Interest 2010.pdf 1,752 × 1,239; 69 KB
-
Average years of schooling versus GDP per capita.jpg 736 × 437; 42 KB
-
Bairoch.svg 1,052 × 744; 19 KB
-
Balance of Payment (Japan, 1979 - 2008).png 765 × 522; 100 KB
-
Balanzas Fiscales 2005 ESP carga-beneficio graf cb-1a.png 1,538 × 990; 48 KB
-
Balanzas Fiscales 2005 ESP flujo monetario graf fm-1.png 1,535 × 988; 49 KB
-
Balança corrente portuguesa (1995-2011).png 608 × 363; 17 KB
-
Banque.PNG 514 × 295; 11 KB
-
Berg Ostry 2011 Chart 4.gif 978 × 528; 11 KB
-
BerLohnquUSABRDJapan.PNG 978 × 632; 39 KB
-
BEVsSales-2010-2023ByCountry.png 1,063 × 868; 756 KB
-
Bezrobocie w Polsce 2002 2008 Barry Kent.PNG 970 × 445; 229 KB
-
Biaroch European GDP per capita 1830-1890.svg 512 × 320; 11 KB
-
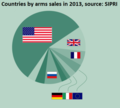
Biggest arms sales 2013.png 575 × 519; 46 KB
-
BitcoinEuroFebMarch2013.jpg 1,024 × 566; 101 KB
-
Botswana-phone.png 607 × 387; 67 KB
-
Boucle notaire janv010.svg 512 × 384; 30 KB
-
Brandt line 2013.png 1,211 × 508; 22 KB
-
BruttostaatsschuldenEuro.png 958 × 593; 29 KB
-
BruttostaatsschuldenEuroEngl.png 958 × 593; 30 KB
-
BW-Aufbau.jpg 930 × 572; 55 KB
-
BW-Aufbau1.jpg 1,026 × 628; 71 KB
-
Case-shiller-index-values.jpg 603 × 387; 34 KB
-
Case-shiller-index.JPG 528 × 420; 25 KB
-
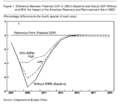
CBO GDP impact of ARRA 2009.png 1,119 × 970; 96 KB
-
CBR Discount Rate 1992-2009.png 1,153 × 774; 14 KB
-
CBR Discount Rate 2002-2009.png 1,154 × 780; 14 KB
-
Ceny piwa.png 1,284 × 669; 142 KB
-
Ceske-hdp.jpg 724 × 478; 64 KB
-
Chart about people.jpg 1,323 × 950; 107 KB
-
Chart of NASDAQ, DJI, FF, USGG10YR, JPY-USD and EUR-USD 2004-.png 888 × 1,347; 272 KB
-
Chart of NASDAQ, DJI, FF, USGG10YR, JPY-USD and EUR-USD.png 716 × 1,104; 353 KB
-
Chile Imports and Exports-de.PNG 615 × 404; 13 KB
-
Chile Imports and Exports.PNG 615 × 404; 16 KB
-
China india gdp.jpg 802 × 456; 49 KB
-
Chipotle Growth Graph.png 600 × 463; 21 KB
-
Christmas Price Index (1984-2009).svg 1,214 × 580; 12 KB
-
Christmas Price Index.png 1,214 × 580; 6 KB
-
Circulation du SEGWAY sur les espaces piétons.pdf 1,239 × 1,754, 2 pages; 914 KB
-
Cleveland msa per capita income.png 460 × 291; 55 KB
-
Commerce extérieur des marchandises suisse à prix constant.png 911 × 623; 34 KB
-
Consumption of Turkey meat.jpg 660 × 617; 53 KB
-
Contributions to Percent Change in Real GDP (the US 1930-1946).png 918 × 574; 15 KB
-
Contributions to Percent Change in Real GDP (the US 1947-1973).png 918 × 575; 85 KB
-
Contributions to Percent Change in Real GDP (the US 1974-1990).png 918 × 574; 17 KB
-
Contributions to Percent Change in Real GDP (the US 1991-).png 918 × 575; 16 KB
-
COP-USD 1998-2009.svg 790 × 480; 63 KB
-
Country foreign exchange reserves minus external debt-ar.png 1,818 × 828; 196 KB
-
Country foreign exchange reserves minus external debt.png 1,818 × 828; 137 KB
-
Courbe des taux de swaps - 12 7 2005.jpg 1,684 × 1,189; 122 KB
-
Courbe des taux de swaps euros 12 7 2005 et courbe implicite un an après.jpg 1,684 × 1,189; 117 KB
-
Coverage ratio Dutch pension funds.png 867 × 548; 235 KB
-
Cpi-categories.jpg 1,260 × 800; 252 KB
-
CPI-U, FF Rate & Prime Rate (1970-1989).png 1,068 × 692; 146 KB
-
CPI-U, FF Rate & Prime Rate (1990-2008).png 1,066 × 692; 42 KB
-
Credit default swaps vs total nominals plus debt.png 1,852 × 1,646; 78 KB
-
Cuba-trade.png 1,695 × 1,291; 62 KB
-
Debito98-07.png 1,019 × 645; 72 KB
-
Deficit or Surplus with Alternative Fiscal Scenario.png 923 × 711; 206 KB
-
Dekkingsbijdrage.jpg 584 × 465; 100 KB
-
Descorrelación DJI-DXD copia.jpg 493 × 363; 93 KB
-
Destination of UK ODA per capita.svg 2,560 × 1,314; 1.05 MB
-
Direkte Bundessteuer CH 2012 linear.PNG 1,123 × 674; 55 KB
-
Direkte Bundessteuer CH 2012 nichtlinear.PNG 1,065 × 664; 47 KB
-
Distribución ingresos autónomos Chile 2006-2009.svg 750 × 400; 34 KB
-
Dwelling-price-to-income ratio 1980 - 2010.pdf 1,239 × 1,752; 59 KB
-
Dynamics of the IPO in Russia.jpg 660 × 827; 112 KB
-
Dynamics of the value of the assets of Islamic banks.jpg 660 × 236; 36 KB
-
EAGLEs ex Chinindia e.JPG 819 × 766; 327 KB
-
EAGLEs vs G7 e.JPG 832 × 761; 194 KB
-
EAGLEs 中国和印度除外.jpg 820 × 769; 90 KB
-
EAGLEs' Nest国家GDP现值和增量.jpg 822 × 776; 90 KB
-
Ebits2c.png 380 × 401; 32 KB
-
Economic developemnt of China, India, Japan and the US during Covid.png 1,288 × 497; 50 KB
-
Economic-damage-from-natural-disasters (OWID 0272).png 850 × 600; 70 KB
-
Economic-losses-from-disasters-share-gdp.png 3,400 × 2,400; 756 KB
-
Economía Argentina PIB.png 1,350 × 438; 34 KB
-
Einkunftsarten D 2007 Anzahl Personen und Ehepaare.png 879 × 580; 33 KB
-
Einkunftsarten D 2007 Einkuenfte je Person.png 894 × 581; 35 KB
-
Einkunftsarten D 2007 Gesamtbetrag der Einkuenfte.png 892 × 572; 34 KB
-
Elastizitäten als Regressionsgerade.jpg 319 × 186; 16 KB
-
Elastizitätsdiagramm zeitlicher versatz.png 560 × 434; 48 KB
-
Employed-fisheries-aquaculture (OWID 0368).png 850 × 600; 49 KB
-
Employed-fisheries-aquaculture-time (OWID 0369).png 850 × 600; 42 KB
-
Employment growth by top tax rate.jpg 712 × 453; 65 KB
-
Energiekonsum.jpg 780 × 495; 93 KB
-
English real wage index 1500 to 1912 Wrigley and Schofield.jpg 871 × 548; 90 KB
-
Eonia Interbankensatz Verlauf von 1999 bis 2009.jpg 2,035 × 520; 193 KB
-
ESt CH ZH Steuersatz 2012 300kCHF.svg 1,000 × 600; 1.05 MB
-
ESt D Auswirkung Splitting.png 1,090 × 695; 30 KB
-
ESt D Historie Durchschnittsteuersatz 1990 2013 280kEuro.svg 1,200 × 600; 1.25 MB
-
ESt D Historie Grenzsteuersatz 1990 bis 2013 280kEuro.svg 1,200 × 600; 1.25 MB
-
ESt D Historie Steuersatz 1996 2014 30kEuro.svg 800 × 600; 1.64 MB
-
ESt D Steuersätze 2010 bis 2014 zvE bis 30000 Euro.svg 917 × 474; 1.89 MB
-
ESt D Tarif 2013 Splitting 120kEUR.svg 1,000 × 600; 178 KB
-
ESt Statistik D Einkünfte Steuersätze Grundtabelle 2004.png 1,228 × 745; 74 KB
-
ESt Statistik D Einkünfte Steuersätze Splitting 2004.png 1,226 × 747; 75 KB
-
ESt Statistik D Steuerpflichtige Grundtabelle 2004.png 1,210 × 746; 54 KB
-
ESt Statistik D Steuerpflichtige Splitting 2004.png 1,212 × 741; 50 KB
-
ESt Stufenbetragstarif.jpg 965 × 593; 215 KB
-
ESt Stufendurchschnittssatztarif.jpg 957 × 591; 328 KB
-
ESt Stufentarif Steuerbeträge Vergleich.jpg 736 × 502; 162 KB
-
ESt Stufentarif Steuersätze Vergleich.jpg 723 × 823; 265 KB
-
EUpopGNPmap.jpg 944 × 652; 86 KB
-
EUpopGNPmap.png 898 × 615; 30 KB
-
EUR-USD 1972-1999.jpg 1,414 × 918; 607 KB
-
Euro95NLDe.jpg 720 × 504; 41 KB
-
European cities real wages.png 1,351 × 623; 132 KB
-
Eurosystem balance sheet total (in LibreOffice).png 842 × 473; 18 KB
-
Eurosystem balance sheet total 2007 mid 2014.png 970 × 604; 27 KB
-
Eurosystem balance sheet total 2007-2011.png 970 × 604; 27 KB
-
Eurosystem balance sheet total.png 970 × 604; 30 KB
-
Eurozone total debt.png 970 × 604; 16 KB
-
Eurozone-structural1.jpg 859 × 553; 60 KB
-
Exchange rates.JPG 512 × 403; 36 KB
-
Exportations1.png 1,475 × 618; 73 KB
-
Fahrgastzahlen imb 1926-1989.gif 796 × 494; 9 KB
-
Fahrgastzahlen strab ibk 1905-1989.gif 1,058 × 658; 13 KB
-
FED und Taylor-Zins.png 664 × 471; 18 KB
-
Fig. 2. Comparison of major US recessions over past 30 years.PNG 693 × 600; 161 KB
-
Finance.svg 360 × 240; 14 KB
-
Fiscal Compliance de.png 841 × 1,048; 89 KB
-
Forecast for farm household income.jpg 486 × 380; 39 KB
-
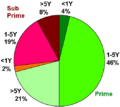
Foreclosure trend - 2007.svg 395 × 407; 15 KB
-
Foreign Exchange Rate (DEM,FRF,GBP,JPY vs USD).png 860 × 617; 137 KB
-
France-urssaf-cotisations-exonerations.svg 466 × 334; 72 KB
-
Friggit paris france serie longue 2010.svg 512 × 410; 19 KB
-
Fy2009spendingbycategory2.png 870 × 628; 77 KB
-
GDP 900-1900 01.png 561 × 283; 19 KB
-
GDP BRICS G7.svg 1,100 × 480; 5 KB
-
GDP Growth Rate 2012-2017.png 1,280 × 720; 19 KB
-
GDP growth rate and GDP deflaltor (YoY) in Norway 1905-1939.png 854 × 637; 144 KB
-
GDP per capita 900-1900.png 560 × 280; 20 KB
-
GDP per capita of China and India.svg 750 × 560; 11 KB
-
GDP per head Europe 1937.png 817 × 646; 43 KB
-
GDP PPP per capita CIS.svg 1,130 × 550; 13 KB
-
GDP PPP Poland.svg 1,130 × 550; 24 KB
-
GDP PPP Russia.svg 1,130 × 590; 6 KB
-
GDP PPP Ukraine.svg 1,000 × 450; 4 KB
-
GDP PPP USA China.svg 1,200 × 500; 10 KB
-
GDP PPP USA.svg 1,000 × 510; 12 KB
-
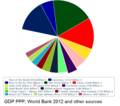
Gdp, ppp world economy 2012.png 747 × 660; 90 KB
-
GDP-Chile-pinochet.png 1,507 × 916; 71 KB
-
Gefühlte Inflation-EA.svg 638 × 412; 100 KB
-
Geldanlage.jpg 301 × 343; 16 KB
-
German GDP in tax havens.png 663 × 294; 24 KB
-
Germany-Tax-Revenues-As-GDP-Percentage-(75-05).JPG 1,412 × 737; 69 KB
-
Germany-Tax-Revenues-As-GDP-Percentage-(85-05).JPG 503 × 305; 31 KB
-
Gini coefficient beside GDP per capita.svg 1,200 × 1,200; 92 KB
-
Globalization-5.png 669 × 669; 200 KB
-
Government surplus or deficit (EU-USA-UK).png 429 × 367; 56 KB
-
Government surplus or deficit since 2001 (piiggs and US).svg 616 × 891; 179 KB
-
Grafico1cepal.jpg 758 × 524; 54 KB
-
Graph (military spenders).jpg 524 × 255; 80 KB
-
Graph GNP TPP.png 250 × 246; 7 KB
-
Graph in Science and the great war (Romanes lecture).png 1,054 × 2,103; 711 KB
-
Graphs 1.jpg 720 × 517; 98 KB
-
Grenzbeitragssatz SV D 2011.PNG 1,005 × 650; 53 KB
-
Gráfica estadística.png 721 × 600; 89 KB
-
Containerumschlag und Prognosen.jpg 1,539 × 1,156; 214 KB
-
HDD-Thailand.png 598 × 373; 18 KB
-
HDI GDPpercapitaPPP.png 671 × 487; 35 KB
-
Herengracht indice fr.svg 512 × 410; 16 KB
-
HHLA-Umsatz.jpg 960 × 720; 62 KB
-
HhlaUmsatz-2016.jpg 960 × 720; 46 KB
-
HhlaUmsatz-2017.jpg 960 × 720; 51 KB
-
HhlaUmsatz.jpg 960 × 720; 44 KB
-
Histo transac.svg 512 × 384; 54 KB
-
Historic Sugar Prices.jpg 1,127 × 547; 135 KB
-
Hladina podpory.png 1,194 × 543; 27 KB
-
IBM's revenue and net income.png 729 × 357; 29 KB
-
IE Real SandP Price-Earnings Ratio, Interest 1871-2006.png 1,151 × 657; 78 KB
-
Impact-of-Austerity-on-Percent-Change-in-Unemployment.png 1,205 × 718; 33 KB
-
Income convergence 1960 to 2000 PWT.png 1,075 × 780; 36 KB
-
Income death in logs graph.JPG 744 × 485; 46 KB
-
Income death rate graph.JPG 849 × 685; 44 KB


