
Category:Economic statistics for the world
.
Subcategories
This category has only the following subcategory.
Media in category "Economic statistics for the world"
The following 58 files are in this category, out of 58 total.
-

-
 1 AD to 2003 AD percent GDP contribution of China to world GDP with history.png 10,619 × 6,350; 1.07 MB
-
 1 AD to 2003 AD percent GDP contribution of India to world GDP with history.png 10,619 × 6,287; 1.02 MB
-
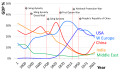
 1 AD to 2008 AD trends in % GDP contribution by major economies of the world.png 9,606 × 6,562; 1,009 KB
-

-

-

-
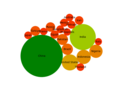 Agriculture bubble.png 639 × 479; 44 KB
-
 Anbau Gv-Mais 2016.png 600 × 600; 37 KB
-
 Asian countries with the highest GDP per capita, 2020 (HY).svg 512 × 288; 77 KB
-
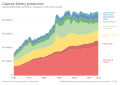 Capture fishery production, OWID.svg 850 × 600; 22 KB
-
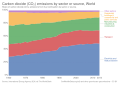 Carbon dioxide (CO₂) emissions by sector or source, OWID.svg 850 × 600; 17 KB
-
 Carbon dioxide emissions by sector, OWID.svg 850 × 600; 14 KB
-
 Comparative statistical tables and charts of the commerce of the world (IA comparativestati00harprich).pdf 860 × 1,322, 120 pages; 3.02 MB
-
 CO₂ emissions by sector, World.svg 850 × 600; 52 KB
-
 Cumulative global plastics production, OWID.svg 850 × 600; 6 KB
-

-

-
 Cumulative-global-plastics (OWID 0211).png 850 × 600; 43 KB
-
 Cumulative-plastic-exports (OWID 0214).png 850 × 600; 64 KB
-
 Dept.svg 990 × 765; 44 KB
-
 Employment in selected energy subsectors, 2019.png 1,920 × 1,080; 380 KB
-
 Gdp accumulated change.png 1,100 × 614; 77 KB
-
 GDP EU TOP 5.svg 990 × 765; 16 KB
-
 GDP of the major powers of the world.PNG 1,303 × 456; 43 KB
-
 GDP per capita of India (1820 to present).png 728 × 402; 1.12 MB
-
 Gdppcppseu27.svg 990 × 765; 14 KB
-
 Global GHG Emissions by Sector 2016.png 1,740 × 1,305; 231 KB
-
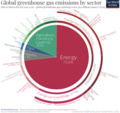
 Global GHG emissions by sector.jpg 1,852 × 1,042; 216 KB
-
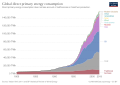 Global primary energy consumption, OWID.svg 850 × 600; 54 KB
-
 Greenhouse gas by sector 2000.svg 650 × 603; 9 KB
-
 Greenhouse Gas Emissions by Sector, 2016.png 1,574 × 1,488; 788 KB
-
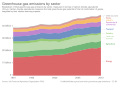 Greenhouse gas emissions by sector, OWID.svg 850 × 600; 15 KB
-
 Hunger seit 1990.jpg 4,400 × 3,602; 783 KB
-
 Industry bubble.png 639 × 479; 44 KB
-
 Maddison GDP perc. of World, top 5.jpg 462 × 251; 34 KB
-
 Military Expenditures by Country 2019.svg 905 × 661; 29 KB
-
 MilitaryExpendituresbyCountry2019.png 1,200 × 876; 111 KB
-
 Nitrous oxide emissions by sector, OWID.svg 850 × 600; 18 KB
-
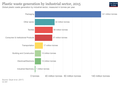 Plastic-waste-by-sector.png 3,400 × 2,400; 381 KB
-
 Podil-hdp.png 912 × 632; 550 KB
-

-
 Services bubble.png 639 × 479; 45 KB
-
 Share of Global GDP.gif 538 × 460; 90 KB
-
 WeltBIPWorldgroupOECD.PNG 1,754 × 1,239; 249 KB
-
 WeltBIPWorldgroupOECDengl.PNG 1,568 × 980; 204 KB
-
 Weltwirtschaftswachstum.png 908 × 681; 55 KB
-
 World energy prices 1991-2010.png 967 × 833; 52 KB
-
 World gdp 2012 see description.png 650 × 500; 17 KB
-
 World GDP Per Capita 1500 to 2000, Log Scale.png 606 × 441; 20 KB
-
 World GDP per capita 1500 to 2003.svg 1,600 × 1,200; 3 KB
-
 World production of coarse grain, 1961-2004.png 589 × 547; 11 KB
-
 World Total Primary Energy Consumption by Fuel (2015).svg 898 × 431; 300 KB
-
 World trade 2000-2010.png 1,603 × 767; 59 KB
-
 World trade.png 722 × 505; 16 KB
-
 World wealth distribution 2012.png 884 × 650; 29 KB
-
 Zinc world production 1900-2022.svg 750 × 590; 9 KB
-
 ´World Bank, icp 2011 gdp ppp world share.png 2,684 × 1,926; 497 KB


.svg)


.svg)

_emissions_by_sector_or_source,_OWID.svg)


,_OWID.svg)
,_OWID.svg)
.png)
.png)


.png)


.svg)


