Category:Greenhouse gas emissions by sector
Jump to navigation
Jump to search
Subcategories
This category has the following 2 subcategories, out of 2 total.
Media in category "Greenhouse gas emissions by sector"
The following 162 files are in this category, out of 162 total.
-
1 ipcc 5th report economic sector impact on environment en.svg 926 × 501; 114 KB
-
2 ipcc 5th report economic sector impact on environment ptbr.svg 926 × 501; 125 KB
-
ACEA agreement progress.png 393 × 275; 9 KB
-
Annual greenhouse gas emissions by sector, in 2010 (color) es.png 1,200 × 831; 79 KB
-
Annual greenhouse gas emissions by sector, in 2010 (color) png no.png 1,200 × 831; 74 KB
-
Annual greenhouse gas emissions by sector, in 2010 (color)-da.png 1,500 × 1,200; 68 KB
-
Annual greenhouse gas emissions by sector, in 2010 (color).png 1,500 × 1,200; 111 KB
-
Annual greenhouse gas emissions by sector, in 2010 (color).svg 461 × 319; 37 KB
-
Annual greenhouse gas emissions by sector, in 2010 (greyscale).png 1,200 × 831; 74 KB
-
Annual world greenhouse gas emissions, in 2005, by sector.png 1,040 × 980; 29 KB
-
Annual world greenhouse gas emissions, in 2005, by sector.svg 1,222 × 1,150; 23 KB
-
Average carbon dioxide emissions (grams) per passenger mile (USA 2008).png 1,018 × 617; 39 KB
-
Average greenhouse gas emissions associated with different food products.png 1,636 × 1,005; 89 KB
-
Building GHG Emissions-Pie.png 1,441 × 989; 45 KB
-
Carbon dioxide (CO₂) emissions by sector or source, OWID.svg 850 × 600; 17 KB
-
Carbon dioxide emissions by sector, OWID.svg 850 × 600; 14 KB
-
Carbon Dioxide Emissions Factor, kg CO₂ per MWh, OWID.svg 850 × 600; 9 KB
-
Carbon-footprint-travel-mode (OWID 0123).png 850 × 600; 81 KB
-
China-CO2-by-source.svg 850 × 600; 70 KB
-
Clune2016 food lca-de.svg 1,000 × 800; 49 KB
-
CO-Anteil 2014.jpg 492 × 324; 48 KB
-
CO2 by fossil fuel Turkey 2016.svg 540 × 540; 20 KB
-
CO2 by fossil fuel Turkey.svg 540 × 540; 20 KB
-
CO2 by fuel pie chart tr.svg 540 × 540; 24 KB
-
Co2 by fuel pie chart.svg 540 × 540; 20 KB
-
CO2 emissions by country and types of transport.jpg 1,847 × 1,325; 562 KB
-
CO2 Emissions by Source Since 1880-cs.svg 960 × 635; 29 KB
-
CO2 Emissions by Source Since 1880-vi.svg 960 × 635; 31 KB
-
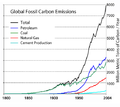
CO2 Emissions by Source Since 1880.svg 960 × 635; 25 KB
-
CO2 Emissions from Electricity Production IPCC TR.png 1,244 × 773; 45 KB
-
CO2 Emissions from Electricity Production IPCC-fi.png 1,244 × 773; 34 KB
-
CO2 Emissions from Electricity Production IPCC.png 1,244 × 773; 42 KB
-
Co2 emissions worldwide in 2014 english.jpg 1,392 × 994; 69 KB
-
Co2 emissions worldwide in 2014 german.jpg 1,335 × 954; 69 KB
-
Co2-emissions-aviation (OWID 0198).png 850 × 600; 103 KB
-
Co2-emissions-domestic-aviation (OWID 0199).png 850 × 600; 102 KB
-
Co2-international-aviation (OWID 0191).png 850 × 600; 101 KB
-
CO2emissions.gif 736 × 504; 14 KB
-
COemissions.gif 736 × 510; 20 KB
-
CO₂ emissions by sector, World.svg 850 × 600; 52 KB
-
EIOLCA GHG.JPG 720 × 567; 41 KB
-
Emission de GES.png 744 × 678; 60 KB
-
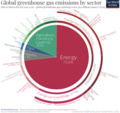
Emissions-by-sector-–-pie-charts.png 1,302 × 1,233; 265 KB
-
EU greenhouse gas emission by source, 2018.png 749 × 709; 102 KB
-
EU-s szén-dioxid-kibocsátás (1990, 2018).jpg 3,805 × 2,597; 2.76 MB
-
GHG clay.gif 567 × 502; 31 KB
-
GHG emissions by sector in Spain.svg 850 × 600; 29 KB
-
GHG Emissions By Sector.png 3,400 × 2,400; 422 KB
-
GHG emissions from energy by sector 2020-cs.svg 1,655 × 999; 17 KB
-
GHG emissions from energy by sector 2020.svg 1,655 × 999; 9 KB
-
GHG from AFOLU.png 729 × 938; 49 KB
-
GHG glass.gif 567 × 512; 32 KB
-
GHG hemp.gif 566 × 509; 32 KB
-
Ghg pie chart Turkey.svg 576 × 432; 37 KB
-
Ghg pie chart.svg 1,080 × 1,080; 42 KB
-
GHG pp.gif 566 × 521; 31 KB
-
Ghg-emissions-by-sector-Italy.svg 850 × 600; 29 KB
-
GHGと土地利用.png 1,906 × 1,406; 267 KB
-
GIEC AR6 WGIII — Émissions directes de GES par secteur en 2019.png 1,280 × 833; 71 KB
-
Global Carbon Emission by Type es.png 555 × 402; 44 KB
-
Global Carbon Emission by Type fr.png 555 × 402; 14 KB
-
Global Carbon Emission by Type ja.png 555 × 402; 15 KB
-
Global Carbon Emission by Type to Y2004.png 555 × 493; 58 KB
-
Global Carbon Emission by Type.png 555 × 402; 17 KB
-
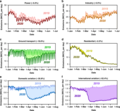
Global daily CO2 emissions for sectors.webp 1,717 × 1,591; 221 KB
-
Global food systems GHG emissions in 2020.png 602 × 501; 112 KB
-
Global GHG emissions by aggregated sector.png 1,852 × 1,042; 88 KB
-
Global GHG Emissions by Sector 2016.png 1,740 × 1,305; 231 KB
-
Global GHG emissions by sector.jpg 1,852 × 1,042; 216 KB
-
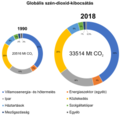
Globális szén-dioxid-kibocsátás (1990, 2018).png 3,654 × 3,496; 457 KB
-
Grafik internationaler und deutscher CO2 Fußabdruck vergleich.jpg 998 × 1,611; 233 KB
-
Greenhouse emissions by electricity source.PNG 944 × 537; 26 KB
-
Greenhouse gas by sector 2000 de.svg 700 × 605; 42 KB
-
Greenhouse gas by sector 2000-tr.svg 650 × 603; 13 KB
-
Greenhouse gas by sector 2000.svg 650 × 603; 9 KB
-
Greenhouse Gas by Sector sv.png 650 × 603; 32 KB
-
Greenhouse Gas by Sector.png 1,632 × 1,632; 366 KB
-
Greenhouse Gas Emissions by Economic Sector tl.svg 960 × 768; 8 KB
-
Greenhouse Gas Emissions by Economic Sector-cs.svg 960 × 768; 14 KB
-
Greenhouse Gas Emissions by Economic Sector-vi.svg 960 × 768; 11 KB
-
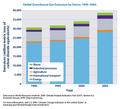
Greenhouse Gas Emissions by Economic Sector.svg 960 × 768; 4 KB
-
Greenhouse Gas Emissions by Sector, 2016.png 1,574 × 1,488; 788 KB
-
Greenhouse gas emissions by sector, Austria, 2018.png 3,400 × 2,400; 422 KB
-
Greenhouse gas emissions by sector, Greece 2016.png 1,504 × 938; 174 KB
-
Greenhouse gas emissions by sector, OWID.svg 850 × 600; 15 KB
-
Greenhouse Gas Emissions from Electricity Production IEA-tr.png 862 × 528; 27 KB
-
Greenhouse Gas Emissions from Electricity Production IEA.GIF 791 × 396; 13 KB
-
Greenhouse Gas Emissions from Electricity Production IEA.PNG 862 × 528; 23 KB
-
Greenhouse gas emissions in Turkey by sector.png 3,400 × 3,391; 1.37 MB
-
Greenhouse gas emissions per 100 grams of protein, OWID.svg 850 × 600; 12 KB
-
Greenhouse gas emissions per 1000 kilocalories, OWID.svg 850 × 600; 20 KB
-
Greenhouse gas emissions per energy source.png 1,688 × 1,041; 118 KB
-
Greenhouse gas emissions per kilogram of food product, OWID.svg 850 × 600; 17 KB
-
Greenhouse-gas-emissions-by-gas.png 3,400 × 2,400; 422 KB
-
Greenhouse-gas-emissions-by-sector.png 3,400 × 2,400; 636 KB
-
Grocery bag comparisons for greenhouse gas emissions, OWID.svg 850 × 600; 9 KB
-
Gwp clay.gif 1,020 × 267; 30 KB
-
Gwp hemp.gif 1,020 × 267; 32 KB
-
Gwp pp.gif 1,020 × 267; 30 KB
-
IEA average lifetime emissions for vehicles sold in 2019.png 1,036 × 632; 78 KB
-
Ipcc 2014 01.svg 600 × 400; 9 KB
-
Ipcc 2014 02-tr.png 752 × 452; 62 KB
-
Ipcc 2014 02.png 1,200 × 800; 90 KB
-
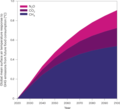
Ipcc 2014 bar graph.png 698 × 661; 26 KB
-
Ireland greenhouse gas emissions by sector.svg 850 × 600; 28 KB
-
Meat and Dairy CO2 Emissions - 20 largest emitters.png 2,066 × 1,351; 398 KB
-
Methane emissions by sector, OWID.svg 850 × 600; 17 KB
-
Methane emissions by sector, Russia, 2018.jpg 3,400 × 2,400; 161 KB
-
Methane global emissions from the five broad categories.png 1,213 × 1,620; 35 KB
-
Net emissions of greenhouse gases of anthropogenic actions.png 927 × 716; 65 KB
-
Nitrous oxide emissions by sector, OWID.svg 850 × 600; 18 KB
-
Overall GHG from Transport.png 4,268 × 4,267; 1.85 MB
-
Per-capita-co2-aviation (OWID 0794).png 850 × 600; 93 KB
-
Per-capita-co2-cement (OWID 0795).png 850 × 600; 90 KB
-
Per-capita-co2-international-aviation (OWID 0784).png 850 × 600; 104 KB
-
Per-capita-co2-sector (OWID 0780).png 850 × 600; 47 KB
-
Per-capita-ghg-sector (OWID 0760).png 850 × 600; 58 KB
-
Per-capita-methane-sector (OWID 0746).png 850 × 600; 43 KB
-
PubtransitHorizontal.png 1,178 × 700; 54 KB
-
Répartition émissions GES combustion France 2010.jpg 529 × 333; 17 KB
-
Sectoral effects of COVID-19 on CO2 emissions.webp 1,805 × 675; 80 KB
-
Sera gazlar dairesel grafik Türkiye.svg 576 × 432; 41 KB
-
Sera gazlar Türkiye 2018.svg 576 × 432; 37 KB
-
Sera gazlar yüzde tablosu Turkçe.svg 600 × 467; 76 KB
-
Share-co2-emissions-aviation (OWID 0940).png 850 × 600; 105 KB
-
Share-co2-international-aviation (OWID 0938).png 850 × 600; 102 KB
-
Share-global-co2-domestic-aviation (OWID 1027).png 850 × 600; 99 KB
-
Sklenikove plyny po sektorech 2000.svg 650 × 603; 15 KB
-
Sources of methane emissions, 2021.jpg 1,648 × 832; 85 KB
-
Sources-of-methane-emissions-2021 (1).png 1,200 × 1,000; 25 KB
-
Sources-of-methane-emissions.png 1,200 × 1,000; 25 KB
-
Sources-overview.png 1,200 × 800; 94 KB
-
THG-Emission-1.pdf 914 × 506; 303 KB
-
THGPNV.jpg 1,849 × 1,325; 343 KB
-
Top 20 intensity of economy emitters.png 3,361 × 2,198; 122 KB
-
Transport CO₂ emissions vs. population density of cities, OWID.svg 850 × 600; 14 KB
-
Turkey greenhouse gas emissions by sector.svg 850 × 600; 29 KB
-
Value-added-growth-vs-emissions-growth-china (OWID 1131).png 850 × 600; 93 KB
-
Value-added-growth-vs-emissions-growth-germany (OWID 1127).png 850 × 600; 87 KB
-
Value-added-growth-vs-emissions-growth-usa (OWID 1128).png 850 × 600; 91 KB
-
Value-added-vs-share-of-emissions-china (OWID 1124).png 850 × 600; 75 KB
-
Value-added-vs-share-of-emissions-germany (OWID 1126).png 850 × 600; 74 KB
-
Value-added-vs-share-of-emissions-usa (OWID 1125).png 850 × 600; 76 KB
-
Weltweite-co2-produktion-durch-zementherstellung.png 927 × 609; 79 KB
-
World-co2-emissions-by-fuel-1990---2035-USDOE-IEA-2011.png 400 × 350; 14 KB
-
Zero-emission-vehicle-commitments (OWID 1093).png 850 × 600; 124 KB
-
Émissions de dioxyde de carbone par source depuis 1880.svg 960 × 635; 18 KB
-
Émissions de gaz à effet de serre par secteur économique.svg 960 × 768; 10 KB
-
Émissions GES combustion France 1990-2010.jpg 567 × 378; 33 KB
-
世界部門別GHG排出内訳.png 1,333 × 1,354; 104 KB
-
食料サプラチェーンGHG.png 2,083 × 1,979; 328 KB


