Category:Transport statistics
Jump to navigation
Jump to search
Statistical charts and other media showing statistical data of transport and transport industry.
Subcategories
This category has the following 11 subcategories, out of 11 total.
A
B
- Bicycle statistics (4 F)
- Bulk carrier statistics (9 F)
D
M
- Modal split (16 F)
R
T
- Transport bar charts (29 F)
Media in category "Transport statistics"
The following 60 files are in this category, out of 60 total.
-
1 4 abb anstieg-suv 2016-02-12 0.png 2,559 × 1,911; 1.42 MB
-
Annual DART Ridership (millions, automatic tracking).png 2,864 × 2,028; 129 KB
-
Annual DART Ridership (millions, manual tracking).png 2,864 × 2,028; 123 KB
-
Annual report of the Board of Commissioners of the Central Park (1858) (17811256164).jpg 3,408 × 1,610; 554 KB
-
Battery-plugin-hybrid-vehicles (OWID 0082).png 850 × 600; 67 KB
-
Canal de l'Ourcq .jpg 2,240 × 1,250; 936 KB
-
Carbon-new-passenger-vehicles (OWID 0122).png 850 × 600; 115 KB
-
Change in Urban Population and Motorisation Rate.png 3,995 × 4,159; 8.77 MB
-
Chariot spread.png 400 × 231; 154 KB
-
CO2 Flottenverbrauch PkW in der EU.svg 365 × 343; 90 KB
-
Co2-emissions-transport (OWID 0197).png 850 × 600; 101 KB
-
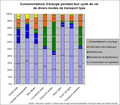
Co2-transport-mode (OWID 0182).png 850 × 600; 70 KB
-
Collecte de données Transport ECPI.png 1,156 × 388; 18 KB
-
Death rate from road accidents, OWID (2017).svg 850 × 600; 142 KB
-
Energy-intensity-transport (OWID 0355).png 850 × 600; 59 KB
-
Enplanementsplot.JPG 944 × 286; 39 KB
-
Fuel-efficiency-new-vehicles (OWID 0489).png 850 × 600; 84 KB
-
Grandes tuileries de Bourgogne Expéditions .jpg 2,594 × 1,702; 1.32 MB
-
Great Britain Passenger Data.jpg 1,674 × 941; 126 KB
-
Imports and exports of passenger cars.jpeg 525 × 367; 117 KB
-
MHD zdarma FM.jpg 570 × 323; 65 KB
-
New-passenger-vehicles-type (OWID 0631).png 850 × 600; 56 KB
-
New-vehicles-type-area (OWID 0630).png 850 × 600; 53 KB
-
New-vehicles-type-share (OWID 0628).png 850 × 600; 53 KB
-
Number-airline-passengers (OWID 0739).png 850 × 600; 49 KB
-
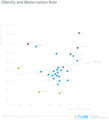
Obesity and Motorisation Rate.png 3,764 × 4,159; 269 KB
-
Passenger and year data.gif 782 × 488; 15 KB
-
Passenger capacity jschoner.png 721 × 464; 22 KB
-
Passenger figures Hurtigruten.png 442 × 275; 8 KB
-
Passenger Numbers over the Recorded History MB.tif 1,602 × 1,008; 559 KB
-
PASSENGER VS YEAR.png 1,575 × 1,142; 64 KB
-
Per-capita-co2-domestic-aviation-vs-gdp (OWID 0796).png 850 × 600; 89 KB
-
Per-capita-co2-transport (OWID 0779).png 850 × 600; 98 KB
-
Per-capita-international-aviation-km (OWID 0759).png 850 × 600; 116 KB
-
Per-capita-km-aviation (OWID 0757).png 850 × 600; 114 KB
-
PubtransitHorizontal.pdf 1,650 × 1,275; 183 KB
-
Reseavdrag i Sverige 1991-2006.JPG 708 × 503; 40 KB
-
Répartition des expéditions de charbon des HBB entre routr, rail et canal.jpg 2,301 × 1,623; 1.27 MB
-
Répartition du trafic de charbon entre route,rail et canal (en %).jpg 2,497 × 1,560; 1.39 MB
-
Sector transporte en el PIB.jpg 4,032 × 3,024; 6.69 MB
-
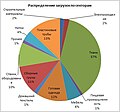
Sector-loading-en.JPG 448 × 422; 27 KB
-
Sector-loading-r.JPG 452 × 422; 28 KB
-
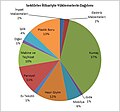
Sector-loading-tr.JPG 451 × 422; 26 KB
-
Staatliche Investitionen ins Schienennetz 2019.jpg 1,004 × 1,450; 230 KB
-
Statistiques du trafic des ports du canal du Centre.jpg 2,864 × 1,618; 1.94 MB
-
StädteSRV.jpg 2,055 × 1,889; 1.03 MB
-
UK rail fares.jpg 922 × 563; 78 KB
-
UK rail private investment.jpg 816 × 492; 56 KB
-
UK rail subsidies.jpg 872 × 557; 77 KB
-
Unconstrained Sydney region passenger movement demand (2010-2060).png 1,302 × 726; 58 KB
-
USA Light Rail Annual Unlinked Passenger Trips.jpeg 931 × 348; 46 KB
-
Verkehrsleistung in Deutschland, Personen-km, 1994-2019.svg 2,268 × 983; 100 KB
-
Verkehrsleistung in Deutschland, Personen-km, 2003-2019.svg 1,063 × 461; 75 KB
-
Verkehrsleistung in Deutschland, prozentuale Anteile, 1997-2014.png 1,109 × 541; 28 KB
-
World Passenger Data.jpg 1,690 × 951; 120 KB
-
Тролейбусні системи Європи.jpg 1,158 × 800; 291 KB


