Category:Structural biology
Jump to navigation
Jump to search
study of molecular structures in biology | |||||
| Upload media | |||||
| Instance of | |||||
|---|---|---|---|---|---|
| Subclass of | |||||
| Part of | |||||
| |||||
Subcategories
This category has the following 18 subcategories, out of 18 total.
*
A
- Ueli Aebi (1 F)
- Amino acid motifs (52 F)
B
C
F
- Fungal structure (41 F)
G
- Goodsell molecular landscape (14 F)
M
- Molecular conformation (22 F)
- Molecule of the Month (74 F)
P
R
- RNA structure (61 F)
S
- Structure validation (20 F)
V
Pages in category "Structural biology"
This category contains only the following page.
Media in category "Structural biology"
The following 119 files are in this category, out of 119 total.
-
1-Palmitoyl-3-oleoyl-phosphatidylcholine Structural Formulae V.1.png 2,976 × 1,142; 36 KB
-
1axc PCNA ProCheck Rama.jpg 500 × 500; 158 KB
-
1BIV Bovine Tat-TAR complex.png 1,600 × 1,200; 877 KB
-
1cag collagen triple helix.tiff 1,200 × 740; 109 KB
-
1dfj RNAseInhibitor-RNAse complex.jpg 725 × 768; 340 KB
-
1gwe antipar betaSheet both.png 2,000 × 1,100; 1.04 MB
-
1QRE L3betaHelix.jpg 949 × 768; 169 KB
-
27 Lys rotamers.png 2,556 × 2,276; 254 KB
-
2k49 NMR ensemble ribbons.jpg 960 × 760; 344 KB
-
2k5d NMR ensemble ribbons.jpg 973 × 725; 394 KB
-
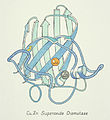
2SOD ribbon colorPencil.jpg 3,200 × 3,500; 5.11 MB
-
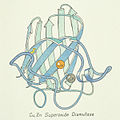
2SOD ribbon pastel.jpg 1,200 × 1,200; 1.41 MB
-
4fby spline het.png 2,640 × 1,840; 1.38 MB
-
4fc1 Arg17 neutron H vs D in map.png 2,388 × 1,793; 1.43 MB
-
50S Hmar 3CC2 ribosome outline.jpg 10,000 × 9,400; 933 KB
-
50S Hmar 3CC2 ribosome outline.png 2,500 × 2,350; 118 KB
-
5fold 2dom 3CDX ribbon.png 900 × 900; 372 KB
-
7si9 surface.png 1,280 × 980; 673 KB
-
AChBoundAlpha7.jpg 664 × 602; 182 KB
-
Ada Yonath.jpg 1,024 × 683; 87 KB
-
Adv-D26 7-24-2021 1 ps.tif 10,042 × 8,063; 231.68 MB
-
All-atomContacts 1gciAlas.jpg 518 × 720; 131 KB
-
Alpha vs 310 helix end views.jpg 1,340 × 720; 178 KB
-
Aminoacyl-tRNA synthetase in complex with cognate tRNA.png 1,677 × 1,920; 2.05 MB
-
Animated Base stacking.gif 200 × 200; 491 KB
-
Bacteriophage Bxb1 Structure.jpg 8,012 × 12,976; 15.81 MB
-
Bacteriophage Lambda.tif 6,814 × 8,063; 8.11 MB
-
Bacteriophage P22.tif 7,996 × 4,031; 8.04 MB
-
Bacteriophage T4 Structural Model at Atomic Resolution.tif 9,022 × 8,063; 13.53 MB
-
Bacteriophage T5 2024 ps.tif 6,130 × 8,063; 7.36 MB
-
Bacteriophage T5 Structural Model at Atomic Resolution.tif 6,153 × 11,237; 13.74 MB
-
Bacteriophage T5 Structure at Atomic Resolution.jpg 7,500 × 12,816; 5.8 MB
-
Bacteriophage T7 Structural Model at Atomic Resolution.tif 2,857 × 3,129; 6.21 MB
-
Beta-catenin-ARM-domain-interactions.png 665 × 780; 59 KB
-
Beta-catenin-destruction-complex.png 719 × 787; 96 KB
-
Beta-catenin-structure.png 472 × 353; 20 KB
-
BmrR-DNA-TPP side view 1R8E.jpg 2,560 × 1,600; 1.01 MB
-
BPTI ribbon 1bpi.jpg 500 × 720; 131 KB
-
BPTI ribbon.jpg 512 × 768; 145 KB
-
BPTI seq ribbon sticks.jpg 1,024 × 768; 246 KB
-
BPTI swish ribbon.jpg 516 × 765; 153 KB
-
CaMKII-dodecameric.png 666 × 664; 549 KB
-
Camodulin elastic network.jpg 500 × 300; 22 KB
-
Cannabinoid CB1 Receptor.png 618 × 439; 98 KB
-
CASP PredCtr cumCalpha plot T0398.jpg 1,000 × 700; 600 KB
-
Catalase diverse alternate conformation network.jpg 2,400 × 1,181; 463 KB
-
Classic beta-bulge schematic.png 660 × 860; 163 KB
-
Coiledcoil-wheelcartoon.png 929 × 555; 38 KB
-
Contacts between two amino acid residues- Q196-R200 (PDB ID- 2X1C).png 604 × 401; 172 KB
-
CuZn SOD precession photo C2.jpg 550 × 550; 215 KB
-
CuZnSOD 2dimers.jpg 700 × 768; 221 KB
-
DNApolymerase-DNA complex 2HHV ribbon.jpg 1,024 × 768; 362 KB
-
Early computer ribbon TrpRepressor intertwinedDimer 1WRP.jpg 1,024 × 768; 342 KB
-
Ecoli 70S ribosome pair with tRNA mRNA.png 2,700 × 2,200; 2.14 MB
-
EIF4E-interaction with cap analogue.png 614 × 528; 141 KB
-
F42 K+channel select stereo.jpg 2,000 × 1,019; 597 KB
-
F44 HolJnct 2crx.jpg 2,700 × 2,700; 1.45 MB
-
FASTpp cartoon.png 481 × 200; 18 KB
-
Felix sequence incantation.ogg 17 s; 223 KB
-
Flavodoxin ribbon BWline.jpg 1,024 × 768; 199 KB
-
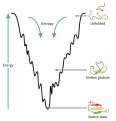
Folding funnel schematic.svg 703 × 729; 201 KB
-
Four-way DNA junction.gif 150 × 150; 325 KB
-
Fragment of Sus scrofa microtubule stabilized with taxol and peloruside.jpg 9,171 × 9,196; 8.24 MB
-
GNRA tetraloop motifs.jpg 1,024 × 768; 262 KB
-
HARH3 H2BS7mar.png 1,500 × 1,200; 1.35 MB
-
Helical Wheel 2NRL 77-92 KaelFischer.jpg 500 × 500; 111 KB
-
Helix electron density myoglobin 2nrl 17-32.jpg 740 × 1,300; 356 KB
-
Hemoglobin t-r state ani.gif 400 × 301; 87 KB
-
Hen egg white lysozyme PDB ensemble.jpg 836 × 656; 155 KB
-
Hiv ligand receptor binding.jpg 300 × 446; 73 KB
-
Human tyrosyl-tRNA synthetase (interdomain interaction, TyrRS).png 3,849 × 2,913; 2.62 MB
-
KiNG backrubFit modeling in density.jpg 3,200 × 2,332; 2.47 MB
-
KiNGinMolProbity validation3Dgraphics.jpg 2,062 × 1,636; 761 KB
-
Molecular view of glutamatergic synapse.jpg 3,241 × 3,079; 6.43 MB
-
Monomeric XEEL.png 500 × 700; 190 KB
-
Mycobacteriophage ZoeJ 7-24-2021 1 ps.tif 4,342 × 8,063; 100.18 MB
-
New York Structural Biology Center 2020 jeh.jpg 4,096 × 2,466; 2.56 MB
-
Nipah 12142023 1 ps.tif 15,992 × 8,063; 91.35 MB
-
Pectate lyase R3betaHelix.jpg 1,024 × 768; 211 KB
-
PhiPsi drawing with plane and labels.jpg 720 × 768; 135 KB
-
Photosynthetic Reaction Center Drawing.png 1,788 × 2,382; 4.13 MB
-
Phyl screencap.jpg 1,124 × 816; 158 KB
-
Poneratoxin 1.tif 720 × 405; 1.12 MB
-
Poneratoxin.tif 720 × 405; 1.12 MB
-
PrealbuminDimer ribbon.jpg 1,024 × 768; 385 KB
-
Protein backbone PhiPsiOmega drawing.jpg 548 × 1,000; 55 KB
-
Protein backbone PhiPsiOmega drawing.svg 520 × 988; 77 KB
-
Protein Hydrogens in electron Density 1yk4 Y13.jpg 1,024 × 768; 287 KB
-
Protein Imager high quality illustration example 1 HIV capsid.png 1,716 × 2,185; 2.46 MB
-
Protein Imager high quality illustration example 2 parathyroid hormone 1 receptor.png 1,633 × 2,185; 1.43 MB
-
Protein Imager interface.png 1,920 × 1,080; 513 KB
-
Protein Imager molecular rendering example 3 CsgFG complex.png 2,152 × 2,185; 6.66 MB
-
Protein structure examples for localization.png 1,571 × 1,938; 4.06 MB
-
Protein structure examples.png 1,571 × 1,938; 3.54 MB
-
Proteinase K with Calcium binding sites.png 694 × 670; 282 KB
-
Rama redux Gly 3600x3600 graOrng.jpg 3,600 × 3,600; 4.18 MB
-
Ramachandran plot general 100K.jpg 750 × 670; 225 KB
-
Ramachandran plot Gly.jpg 750 × 670; 258 KB
-
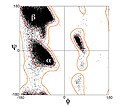
Ramachandran plot original outlines.jpg 500 × 500; 67 KB
-
Ramachandran plot Pro.jpg 750 × 670; 120 KB
-
Rave screencap.jpg 1,248 × 780; 165 KB
-
RDC curves on NMRmodels 1d3z D58NH.jpg 1,024 × 768; 141 KB
-
RibonucleaseA ribbon 7rsa.jpg 880 × 800; 193 KB
-
RibonucleaseA Uvan inhibitor contacts 1ruv.jpg 610 × 768; 226 KB
-
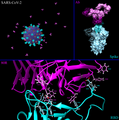
SARS-CoV-2 Infection Structural Analysis.png 7,996 × 8,062; 11.45 MB
-
Schematic of dysferlin, myoferlin, and otoferlin.png 2,061 × 775; 732 KB
-
Shuguang QTY illulstration.tif 7,386 × 2,961; 2.93 MB
-
Spade screencap.jpg 1,920 × 1,200; 318 KB
-
Structural Biology and Drug Discovery.png 1,356 × 580; 318 KB
-
Structure of a bacterial cellulose synthase.png 929 × 785; 308 KB
-
Structure validation concept.jpg 2,200 × 2,200; 1.28 MB
-
Surfacetype Solvent-Accessible.png 923 × 833; 24 KB
-
T Bacteriophages 2024.tif 15,992 × 8,063; 39.7 MB
-
Target3dsmRib 354predictedModels CASP8.jpg 1,200 × 1,006; 647 KB
-
Tissue Plasminogen Activator Spinning Animation.gif 600 × 579; 8.73 MB
-
Transthyretine.jpg 806 × 731; 175 KB
-
Uracil-DNA glycosidase.jpg 1,939 × 1,254; 757 KB
-
Wenxiang diagram.jpg 410 × 392; 115 KB
-
XEEL animated.gif 640 × 673; 20.23 MB


