Category:Maps of weather and climate of North America
Jump to navigation
Jump to search
Temperate regions: North America · South America · Africa · Europe · Asia · Oceania – Polar regions: Antarctica · Arctic – Other regions:
Subcategories
This category has the following 25 subcategories, out of 25 total.
Media in category "Maps of weather and climate of North America"
The following 46 files are in this category, out of 46 total.
-
133 of 'Elementary Physical Geography' (11299645834).jpg 1,416 × 1,151; 388 KB
-
139 of 'Elementary Physical Geography' (11299712006).jpg 1,391 × 972; 260 KB
-
141 of 'Elementary Physical Geography' (11299192074).jpg 1,372 × 963; 257 KB
-
69 of 'History of the American Civil War, etc' (11094786234).jpg 1,449 × 2,196; 766 KB
-
Air quality 2023 canadian wildfires.png 2,067 × 1,128; 409 KB
-
Air temperature North America heatwave geos5 20240619.jpg 720 × 815; 434 KB
-
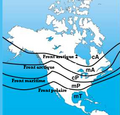
Airmassesorigin.png 300 × 226; 20 KB
-
Anomalía temperaturas 2014-01-10.jpg 720 × 540; 181 KB
-
Blocage air froid.png 481 × 697; 337 KB
-
Circulation Northeaster.png 522 × 644; 44 KB
-
Clipper albertain.png 730 × 347; 466 KB
-
Colorado low circulation.png 1,280 × 1,024; 169 KB
-
December 1992 Nor'easter (Dec 11).jpg 202 × 243; 13 KB
-
December 1992 Nor'easter.jpg 305 × 241; 17 KB
-
DesmondAtmosphericRiver.png 1,023 × 526; 596 KB
-
Doe cosources nov3.jpg 500 × 486; 48 KB
-
El ninjo nordamerika vetero.png 529 × 677; 118 KB
-
El nino north american weather fr.png 529 × 677; 72 KB
-
El nino north american weather.png 529 × 677; 64 KB
-
GOES-IR-OCT-19-13-0345-UTC.jpg 720 × 480; 141 KB
-
Greenland t-anom jul 30 - aug 5 2019.png 645 × 565; 94 KB
-
Ice Sheet Mass Balance from GRACE.ogv 21 s, 1,920 × 1,080; 21.6 MB
-
Incêndios Canadá Jun 2021.jpg 720 × 891; 225 KB
-
Koppen-Geiger Map North America future.svg 1,816 × 850; 14.85 MB
-
Koppen-Geiger Map North America present.svg 1,816 × 850; 14.65 MB
-
Koppen-Geiger Map Northern America future.svg 1,816 × 850; 13.22 MB
-
Map of eastern woodland tribes.png 1,211 × 1,380; 1.11 MB
-
Masse dair.png 285 × 273; 108 KB
-
Midwestsmoke geos5 2023165.jpg 720 × 665; 373 KB
-
Mjo north america rain.png 556 × 749; 28 KB
-
MN weatherpatterns.svg 770 × 800; 310 KB
-
November 2010 windstorm victim nations.png 2,960 × 1,029; 212 KB
-
Southeast Ice Storm of 1994.jpg 820 × 579; 146 KB
-
Storm of the century satellite.gif 512 × 765; 110 KB
-
Subtropridgejulyna.gif 625 × 445; 12 KB
-
July mean flow at 18000 feet.png 625 × 445; 9 KB
-
Triple R NDJFMAM 2012 2015 printable.pdf 2,362 × 1,772; 290 KB
-
Triple R NDJFMAM 2012 2015 printable.svg 1,513 × 1,135; 223 KB
-
Vents altitude vapeur eau.gif 640 × 480; 127 KB
-
Vents altitude vapeur eau.png 640 × 480; 119 KB
-
Visualize historical hurricane tracks.tiff 2,276 × 1,630; 14.16 MB
-
Winterpatterns.gif 505 × 631; 13 KB


