Category:Maps of regions of the United States
Jump to navigation
Jump to search
Subcategories
This category has the following 15 subcategories, out of 15 total.
E
M
N
S
U
W
Media in category "Maps of regions of the United States"
The following 103 files are in this category, out of 103 total.
-
1983 US tors.png 1,130 × 700; 187 KB
-
Animation relief USA.gif 171 × 151; 66 KB
-
Army rotc brigade map.jpg 580 × 521; 71 KB
-
ARS service regions.jpeg 530 × 416; 172 KB
-
ATSDR regionmap.png 449 × 373; 30 KB
-
BEA regions.png 747 × 508; 97 KB
-
Black Drink map HRoe 2008.jpg 662 × 458; 335 KB
-
Border Region.png 809 × 623; 369 KB
-
Census Regions and Division of the United States.svg 942 × 719; 1.27 MB
-
Census Regions and Divisions.PNG 909 × 692; 92 KB
-
CIVSA Regional Map.png 593 × 384; 39 KB
-
Commuter Megaregions of the United States (lower 48.png).png 3,507 × 2,480; 6.47 MB
-
Commuter Megaregions of the United States (map 1.png).png 3,507 × 2,480; 10.16 MB
-
Commuter Megaregions of the United States (map 14.png).png 3,507 × 2,480; 3.11 MB
-
Commuter Megaregions of the United States (map 2.png).png 3,507 × 2,480; 8.5 MB
-
Commuter Megaregions of the United States (map 5.png).png 3,507 × 2,480; 8.5 MB
-
Commuter Megaregions of the United States (map 6.png).png 3,507 × 2,480; 11.27 MB
-
Commuter Megaregions of the United States (map 8.png).png 3,507 × 2,480; 9.26 MB
-
Delawarevalleymap.png 300 × 300; 29 KB
-
Delta Sigma Theta map.svg 1,150 × 799; 368 KB
-
Delta.SigmaThetaMap.png 800 × 530; 92 KB
-
Different side of the U.S. West Coast.png 1,170 × 800; 188 KB
-
Digest of Game Laws for 1901 (1901) (14783634232).jpg 3,488 × 2,160; 465 KB
-
Terrestrial ecoregions USA CAN MEX.svg 1,712 × 1,992; 696 KB
-
Regions of the United States EPA.svg 959 × 593; 119 KB
-
Export-Import Bank of the United States Regional Export Centers.jpg 550 × 292; 119 KB
-
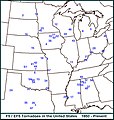
F5tornadoes.jpg 727 × 763; 187 KB
-
Federal Radio Commission General Order 40 Map.png 563 × 377; 11 KB
-
Federal Standard Regions map.png 490 × 321; 71 KB
-
Fema regions map.png 1,436 × 940; 161 KB
-
FEMA regions.png 470 × 306; 186 KB
-
Fencing Regions Map.png 286 × 186; 40 KB
-
Foundry-Garreau.png 572 × 371; 21 KB
-
HWV RegionalMap.jpg 4,813 × 4,813; 1.64 MB
-
JeffFryDetail.jpg 656 × 677; 102 KB
-
JRDA USA Regions.jpg 1,513 × 983; 138 KB
-
Lepomis punctatus RangeMap.jpg 985 × 614; 133 KB
-
Library of Congress Regions.gif 565 × 280; 20 KB
-
LoafNJugMap.JPG 640 × 480; 36 KB
-
Map of East Tennessee counties.png 1,000 × 245; 34 KB
-
Map of Great Plains.png 904 × 593; 28 KB
-
Map of Middle Tennessee counties.png 1,000 × 245; 35 KB
-
Map of USA highlighting coastal states.svg 959 × 593; 89 KB
-
Map of USA Old South.svg 286 × 186; 100 KB
-
Map of USA showing regions.png 800 × 495; 141 KB
-
Map of West Tennessee counties.png 1,000 × 245; 34 KB
-
Map-USA-Regions01(ja).png 1,500 × 1,246; 598 KB
-
Map-USA-Regions01(pt).png 1,500 × 1,246; 684 KB
-
Map-USA-Regions01-wth.png 1,340 × 1,020; 674 KB
-
Map-USA-Regions01.png 1,500 × 1,246; 661 KB
-
Map-USA-Regions01.svg 744 × 1,052; 1.77 MB
-
Map-USA-Regions02 (fr).png 2,504 × 2,598; 1.64 MB
-
Map-USA-Regions02 (ru).png 1,855 × 1,924; 1.14 MB
-
Map-USA-Regions02.svg 556 × 577; 1.29 MB
-
Mid-continent Oil Field map.png 572 × 371; 15 KB
-
Moku o Oahu.jpg 975 × 750; 162 KB
-
National Consumer Media Map.gif 599 × 516; 23 KB
-
NIRSA Region Map.png 960 × 600; 118 KB
-
NIRSA USA Regions.svg 960 × 600; 233 KB
-
NPS Regions.JPG 543 × 415; 43 KB
-
Odum 1936 Southern map.jpg 1,513 × 983; 224 KB
-
OSTEM US Regions.png 5,175 × 3,762; 576 KB
-
Per capita personal income change in metropolitan counties, 1980-2002.png 1,220 × 861; 171 KB
-
Petroleum Administration for Defense Districts.svg 959 × 593; 32 KB
-
PRSRegion.jpg 960 × 720; 59 KB
-
Region2.svg 744 × 1,052; 101 KB
-
Regionl map of the United States.png 1,513 × 983; 70 KB
-
Regions of the Forest Service.jpg 522 × 363; 56 KB
-
Regions of the United States of America (Alternative).svg 958 × 602; 204 KB
-
Rust-belt-map.jpg 280 × 183; 19 KB
-
Secciones regionales propuestas de los Estados Unidos de Wikimedia.svg 1,097 × 687; 275 KB
-
Southern counties with 40 percent African-American population in 2000.png 1,513 × 983; 173 KB
-
Southern United States by Christopher A. Cooper and H. Gibbs Knotts.png 1,513 × 983; 48 KB
-
State map of the Junior State of America.png 1,202 × 764; 148 KB
-
Sun belt.svg 959 × 593; 99 KB
-
The South and Deep South.png 5,400 × 3,586; 1.27 MB
-
The Virginias.png 1,000 × 618; 138 KB
-
United States Administrative Divisions Cities.png 1,513 × 983; 76 KB
-
United States Administrative Divisions unnumbered-HE.png 1,513 × 983; 83 KB
-
United States Administrative Divisions unnumbered.png 1,513 × 983; 64 KB
-
United States Administrative Divisions.png 1,513 × 983; 124 KB
-
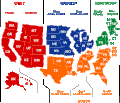
UNOS-OPTN Region Map.png 528 × 280; 31 KB
-
US 9 regions.svg 959 × 593; 83 KB
-
US Amateur Callsign Regions.jpg 2,112 × 1,632; 995 KB
-
US Atlantic States.svg 1,181 × 731; 2.23 MB
-
US Census geographical region map.svg 959 × 593; 148 KB
-
US Pacific States.svg 1,181 × 731; 2.22 MB
-
US regions base map.png 572 × 371; 10 KB
-
USA Economics region.png 3,543 × 2,378; 1.04 MB
-
USA regions map (cs).png 2,350 × 2,438; 1.44 MB
-
USA Südosten-Mikasuki.png 765 × 712; 715 KB
-
USA Südosten-Ofo.png 765 × 712; 718 KB
-
USBLM meridian map 5th PM.jpg 850 × 800; 117 KB
-
USFederalRegions.svg 1,530 × 990; 194 KB
-
Usfrostbeltregions.PNG 800 × 525; 132 KB
-
USFS regions map.jpg 522 × 363; 42 KB
-
USregions-ms.png 1,281 × 599; 152 KB
-
Vs chorochromatisch.PNG 1,576 × 1,081; 106 KB
-
West Coast of the U.S.png 4,700 × 4,515; 1.75 MB
-
West Coast of the United States map.svg 959 × 593; 27 KB
-
West Coast USA.png 696 × 665; 75 KB
-
Wikimedia Regional Chapters of the USA.svg 1,097 × 687; 248 KB
-
Zonas tornádicas de América del Norte.png 2,147 × 2,178; 228 KB


