Category:Biology diagrams
Jump to navigation
Jump to search
English: Biology diagrams.
Wikimedia category | |||||
| Upload media | |||||
| Instance of | |||||
|---|---|---|---|---|---|
| |||||
Subcategories
This category has the following 37 subcategories, out of 37 total.
*
A
- Archaea diagrams (29 F)
B
C
- Cenograms (4 F)
- Cloning diagrams (22 F)
E
F
- Biology flow charts (18 F)
G
L
- Life on Earth by weight (16 F)
P
- Biology plots (6 F)
- Proteomics diagrams (22 F)
S
T
U
V
W
Z
Pages in category "Biology diagrams"
The following 2 pages are in this category, out of 2 total.
Media in category "Biology diagrams"
The following 200 files are in this category, out of 794 total.
(previous page) (next page)-
221115 Natures envelope top.tif 2,637 × 1,842; 23.57 MB
-
5ARassay.jpg 959 × 241; 21 KB
-
6-Phosphofructo-2-kinase.png 747 × 370; 27 KB
-
A subunit, AB5 toxin.png 735 × 318; 3 KB
-
Aco branches.svg 800 × 600; 12 KB
-
Active Transport - Protein Pumps.png 1,416 × 1,002; 403 KB
-
ADP ATP shuttle.png 1,107 × 873; 40 KB
-
Agouti Locus inheritance pattern F1.png 1,025 × 1,011; 59 KB
-
Agouti Locus inheritance pattern F2.png 1,025 × 1,011; 58 KB
-
Alpha TAT1.png 1,026 × 68; 4 KB
-
Alternatives to Darwinism Leading to Orthogenesis.svg 744 × 1,052; 534 KB
-
Amoeba's life.jpg 2,560 × 1,920; 1.32 MB
-
Anabolism and Catabolism.png 1,416 × 672; 148 KB
-
Analise de endemicidade.jpg 497 × 375; 99 KB
-
Animalia II (transparency).png 1,671 × 2,045; 108 KB
-
AnimalsRelativeNumbers.png 1,031 × 750; 160 KB
-
Anreicherung einer Nahrungspyramide.jpg 3,508 × 2,480; 761 KB
-
Anreicherung in Nahrungsketten.jpg 2,480 × 3,508; 890 KB
-
Antagonist 3.png 420 × 356; 15 KB
-
Antarctic Icebergs- Unlikely Oases for Ocean Life (5754963873).jpg 2,000 × 1,515; 394 KB
-
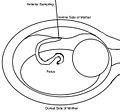
Anterior Sampling-ru.svg 643 × 598; 5 KB
-
Anterior Sampling.jpg 643 × 598; 35 KB
-
Antibody actions.jpg 700 × 500; 61 KB
-
Antineoplastic resistances.png 1,020 × 768; 210 KB
-
Ap biology scienceofbiology01.jpg 400 × 400; 67 KB
-
Apoplast and symplast pathways esperantigita teksto.png 1,070 × 759; 92 KB
-
Arbre de parenté des primates.jpg 1,564 × 929; 360 KB
-
Arc 2.png 2,609 × 3,592; 34 KB
-
Aristotle Senses Perception Memory Dreams Action.svg 1,052 × 744; 75 KB
-
Artery Vein Capillary Comparison.png 1,416 × 672; 114 KB
-
ArteS.jpg 550 × 530; 92 KB
-
Arthropod segment Hox gene expression.svg 588 × 898; 204 KB
-
ATM target proteins (new).png 2,961 × 2,346; 43 KB
-
ATM target proteins.png 594 × 471; 9 KB
-
ATM target proteins.tif 2,468 × 1,955; 158 KB
-
Atv1.jpg 781 × 573; 52 KB
-
Atv12.jpg 360 × 253; 20 KB
-
Auk Volume 13-1896 (page 125, cropped).png 1,727 × 767; 1.83 MB
-
Ausbildung Biologisch-Technischer Assistent.svg 1,941 × 914; 173 KB
-
Autonomic and Somatic Nervous System.png 1,416 × 672; 127 KB
-
Balancer screenfig5.JPG 774 × 622; 30 KB
-
Batesian vs Müllerian Mimicry.svg 1,052 × 557; 1.2 MB
-
Biacore-english.svg 1,052 × 744; 200 KB
-
Biacore-francais.svg 1,052 × 744; 200 KB
-
Biacore-without-language.svg 1,052 × 744; 187 KB
-
Bilirubina amb la UnaG.jpg 2,000 × 1,660; 246 KB
-
Bio5.PNG 519 × 396; 39 KB
-
Biochem evolution timeline.jpg 1,224 × 1,584; 91 KB
-
Biochem evolution timeline.pdf 1,275 × 1,650; 13 KB
-
Biodiversity Loss and Enclosure of Living Organisms.png 1,650 × 1,275; 138 KB
-
Bioelementos.jpg 697 × 441; 113 KB
-
Biologia sistêmica roots.png 693 × 482; 66 KB
-
Biological and technological scales compared-es.svg 1,062 × 755; 1.52 MB
-
Biological and technological scales compared-fr.svg 1,062 × 755; 1.46 MB
-
Biological and technological scales compared-mk.svg 1,062 × 755; 1.59 MB
-
Biological holarchy.png 276 × 201; 10 KB
-
Biologie.svg 604 × 705; 192 KB
-
Biology disciplines.svg 761 × 716; 341 KB
-
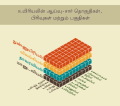
Biology tamil.svg 970 × 860; 476 KB
-
Biology.svg 671 × 523; 135 KB
-
Biomasa.jpg 500 × 398; 37 KB
-
BioMOCA.gif 519 × 396; 39 KB
-
Bistable Switch in Mitotic Exit.jpg 960 × 631; 56 KB
-
Black lipid membrane.svg 709 × 590; 122 KB
-
Blastocisto.jpg 960 × 720; 41 KB
-
Blastocyst(blastotsüst) Eesti.png 608 × 504; 66 KB
-
Blastula.png 707 × 371; 171 KB
-
Blattfarbstoffextrakt.jpg 2,480 × 3,508; 293 KB
-
Blending Inheritance.pdf 1,500 × 1,125; 7 KB
-
Blending Inheritance.svg 900 × 675; 23 KB
-
Bobtail Squid Light Organ.svg 900 × 675; 66 KB
-
BreadWheatEvolution.PNG 292 × 358; 9 KB
-
BreadWheatEvolution.svg 400 × 400; 20 KB
-
Cadena trófica.png 629 × 450; 13 KB
-
Callospermarion pusillum reconstruction.jpg 2,130 × 3,387; 7.97 MB
-
Cambrian substrate revolution 02.png 364 × 265; 61 KB
-
Camodulin elastic network.jpg 500 × 300; 22 KB
-
CaMV replication.svg 1,315 × 485; 74 KB
-
CD8 receptor.png 406 × 243; 5 KB
-
CDC6 Function.jpg 616 × 757; 89 KB
-
Cellular Respiration Simple.png 2,037 × 674; 86 KB
-
Cellulosa (1).svg 744 × 1,052; 28 KB
-
Cephalopod photophore structu.svg 1,052 × 744; 128 KB
-
Characteristics of life-ru.svg 512 × 358; 18 KB
-
Characteristics of life-uk.svg 512 × 358; 22 KB
-
Characteristics of life.svg 512 × 358; 91 KB
-
Chordate Blastula fate map.PNG 290 × 290; 30 KB
-
Chronospecies.svg 724 × 1,099; 8 KB
-
Chronotype and age.svg 600 × 600; 31 KB
-
Chronotypen.svg 1,010 × 480; 335 KB
-
Circular Permutation In Proteins.svg 353 × 400; 15 KB
-
Circulation of blood through the heart.png 3,000 × 2,000; 509 KB
-
Citometria de flux.JPG 411 × 505; 18 KB
-
Cladistic species.svg 744 × 1,052; 11 KB
-
Clap and Fling 1- clap 1.png 673 × 294; 12 KB
-
Clap and Fling 1- clap 1.svg 607 × 264; 21 KB
-
Clap and Fling 2- clap 2.png 451 × 264; 8 KB
-
Clap and Fling 2- clap 2.svg 414 × 227; 19 KB
-
Clap and Fling 3 - clap 3.png 410 × 313; 8 KB
-
Clap and Fling 3 - clap 3.svg 377 × 295; 25 KB
-
Clap and Fling 4- fling 1.png 408 × 245; 7 KB
-
Clap and Fling 4- fling 1.svg 365 × 208; 10 KB
-
Clap and Fling 5- fling 2.png 503 × 258; 10 KB
-
Clap and Fling 5- fling 2.svg 461 × 219; 22 KB
-
Clap and Fling 6- fling 3.png 635 × 312; 13 KB
-
Clap and Fling 6- fling 3.svg 587 × 281; 31 KB
-
ClasificacionSeresVivos.png 910 × 816; 61 KB
-
Clytia hemisphaerica female gonad.svg 512 × 285; 10 KB
-
Clytia hemisphaerica Lifecycle.svg 512 × 453; 108 KB
-
Cniderian.jpg 894 × 400; 46 KB
-
CollapsedtreeLabels-simplified, Animals emphasized.svg 800 × 528; 31 KB
-
Colonial Flagellate Hypothesis.svg 512 × 171; 203 KB
-
ColonialFlagellateHypothesis.png 1,288 × 429; 81 KB
-
CombinedHypothesisPleistoceneExtinction.gif 200 × 578; 9 KB
-
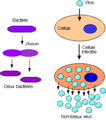
Comparaison virus bacteries.png 288 × 326; 4 KB
-
ComparaisonChatApattesnoires.svg 785 × 720; 303 KB
-
ComparaisonChatPiedsNoirs.svg 594 × 590; 342 KB
-
Comparation.JPG 694 × 398; 26 KB
-
Complement alternative.svg 2,001 × 394; 582 KB
-
Complement leclassic.svg 2,028 × 628; 987 KB
-
Complement pathway.png 688 × 834; 89 KB
-
Comprehensive map of RB pathway.png 2,917 × 4,055; 1.38 MB
-
Conditional Knockout Mouse.jpg 427 × 277; 53 KB
-
Consumer demand curves for animals.jpg 720 × 540; 28 KB
-
Cos-huma-nivells-organitzacio-ca.svg 1,600 × 1,500; 458 KB
-
Cos-huma-nivells-organitzacio-en.svg 1,600 × 1,500; 454 KB
-
Cos-huma-nivells-organitzacio-es.svg 1,600 × 1,500; 460 KB
-
Cos-huma-nivells-organitzacio-fr.svg 1,600 × 1,500; 485 KB
-
Cos-huma-nivells-organitzacio-mut.svg 1,600 × 1,500; 434 KB
-
Counteracting shadow.jpg 960 × 720; 48 KB
-
Counteracting shadow.svg 952 × 744; 152 KB
-
Countershading.jpg 960 × 720; 40 KB
-
Countershading.svg 952 × 744; 14 KB
-
Covalent binding for Wiki project.jpg 486 × 127; 15 KB
-
Crabtree 1.jpg 393 × 479; 171 KB
-
Creode.jpg 265 × 190; 15 KB
-
CrystalDrops.svg 530 × 1,322; 78 KB
-
CSIRO ScienceImage 3720 Termites use vibrations to select their food.jpg 1,772 × 1,176; 680 KB
-
Curved membrane principle.png 745 × 750; 36 KB
-
Cuttlefish2.png 360 × 444; 39 KB
-
D-ROMs.png 1,454 × 718; 101 KB
-
Darwin - O powstawaniu gatunków - tablica s. 95.jpg 1,827 × 2,541; 1.36 MB
-
Darwin's Pangenesis-ru.svg 912 × 297; 13 KB
-
Darwin's Pangenesis.svg 925 × 317; 13 KB
-
DCas9 Suntag Activator (2).jpg 558 × 302; 34 KB
-
DCas9-Suntag activator.svg 4,600 × 3,966; 317 KB
-
DCas9-VPR activator.svg 4,600 × 3,966; 520 KB
-
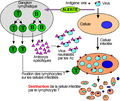
Defenses organisme.png 398 × 335; 15 KB
-
Degradation rate.JPG 663 × 199; 14 KB
-
Delay Line Model.JPG 225 × 256; 11 KB
-
Deleccion.png 464 × 490; 121 KB
-
Desarrollo en plantas y animales.png 565 × 772; 79 KB
-
Desarrollo gonadal desde la gonada bipotencial.png 769 × 364; 86 KB
-
Destruenten im Stoffkreislauf.svg 1,010 × 460; 7 KB
-
Deuterostomia.png 590 × 263; 104 KB
-
Diagram of a Plant.jpg 1,893 × 1,223; 649 KB
-
Diagram of mitosis.svg 477 × 337; 252 KB
-
Diagram of Trophic Layers & Energy Transfer in an Ecosystem.svg 512 × 448; 835 KB
-
Diagramme de l'organisation biologique.png 800 × 1,115; 32 KB
-
Die Gartenlaube (1872) b 355.jpg 1,508 × 1,460; 571 KB
-
Die Keimbahn.png 1,240 × 786; 79 KB
-
Diff betw sexes.png 516 × 360; 4 KB
-
Different case of temperature dependent sex determination.png 2,541 × 1,964; 1,015 KB
-
Disruptive versus Distractive Camouflage Markings.svg 1,044 × 523; 118 KB
-
DNA (meta)barcoding differences.pdf 1,593 × 797; 86 KB
-
DNA Electrostatics.jpg 718 × 371; 56 KB
-
Dna-g946091490 1920.jpg 1,920 × 960; 269 KB
-
DNAPot.Biology.Online.Study.001.Copyright.2010.jpg 654 × 490; 92 KB
-
Doc1finalani.pdf 1,275 × 1,650, 2 pages; 513 KB
-
Dodder and its use of haustoria.svg 512 × 384; 141 KB
-
Dollo's law of irreversibility.svg 873 × 640; 18 KB
-
Dynamiczna niestabilność mikrotubul007.PNG 957 × 342; 5 KB
-
Dysaphis anthrisci majkopica.gif 580 × 479; 22 KB
-
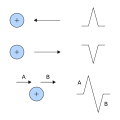
ECG Vector.svg 700 × 700; 11 KB
-
Echelleduvivant.jpg 525 × 1,174; 269 KB
-
Eco 92.jpg 3,510 × 2,206; 447 KB
-
Effect of GC-content on the number of reads in NGS experiments.svg 317 × 123; 5.02 MB
-
Effet de Porphyra-334 sur les fibroblastes humaines exposés aux rayons UVA.pdf 1,500 × 1,125; 260 KB
-
Effet du porphyra-334 sur des fibroblastes humains exposés aux UVA.pdf 1,500 × 1,125, 2 pages; 285 KB
-
Egg xtracts.png 832 × 340; 40 KB
-
Eigenmannia sensory coding for jamming avoidance response.svg 575 × 406; 33 KB
-
Electrocytes adapted from muscle.svg 2,125 × 1,611; 259 KB
-
Electroreception types and taxonomic distribution.svg 960 × 720; 10 KB
-
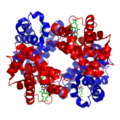
Emoglobina.png 250 × 250; 75 KB
-
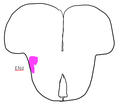
ENd.png 970 × 851; 52 KB
-
Endosymbiose.jpg 1,899 × 285; 198 KB
-
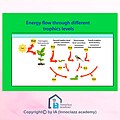
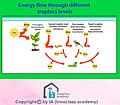
Energy flow through different tropic levels.jpg 1,500 × 1,500; 113 KB
-
Energy flow through various levels of ecosystem.jpg 1,278 × 1,116; 198 KB
-
Enhancer FACS seq overview.jpg 720 × 1,662; 141 KB
-
Espèces identifiées et non identifiées.jpg 910 × 374; 44 KB
-
Estructura esmalte priosphenodon.png 883 × 841; 1.35 MB
-
Evolution concentration.jpg 425 × 459; 13 KB
-
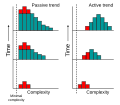
Evolution of complexity.svg 1,665 × 1,452; 48 KB
-
Evolution-gallertoide.jpg 1,127 × 1,183; 324 KB
-
Example discrimination gradient.png 344 × 325; 23 KB
-
Example of Extrapolation121009 1.jpg 960 × 720; 89 KB
-
Expressão genética.jpg 1,012 × 567; 39 KB


