Category:SVG biology
Jump to navigation
Jump to search
Subcategories
This category has the following 15 subcategories, out of 15 total.
Pages in category "SVG biology"
This category contains only the following page.
Media in category "SVG biology"
The following 200 files are in this category, out of 303 total.
(previous page) (next page)-
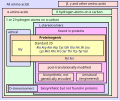
AA hierarchy.svg 562 × 469; 22 KB
-
Aa structure function (2).svg 284 × 308; 753 bytes
-
Aa structure function.svg 286 × 312; 5 KB
-
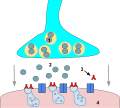
Acetyl choline deficiencies in Myasthenia gravis.svg 512 × 460; 52 KB
-
Aco branches.svg 800 × 600; 12 KB
-
Alternatives to Darwinism Leading to Orthogenesis.svg 744 × 1,052; 534 KB
-
Alternatives to Darwinism.svg 1,052 × 744; 56 KB
-
Amniotatree.svg 1,500 × 900; 32 KB
-
Anterior Sampling-ru.svg 643 × 598; 5 KB
-
Antibody chains-bn.svg 332 × 500; 5 KB
-
Antibody chains-es.svg 400 × 500; 11 KB
-
Antibody chains-mr.svg 332 × 500; 10 KB
-
Antibody chains-ru.svg 332 × 500; 9 KB
-
Antibody chains-ta.svg 332 × 500; 8 KB
-
Antibody chains-te.svg 332 × 500; 8 KB
-
Antibody chains.svg 332 × 500; 4 KB
-
Apop.svg 326 × 244; 12 KB
-
Arthropod segment Hox gene expression.svg 588 × 898; 204 KB
-
Ausbildung Biologisch-Technischer Assistent.svg 1,941 × 914; 173 KB
-
Babesia microti life cycle numbered.svg 564 × 367; 90 KB
-
Batesian vs Müllerian Mimicry.svg 1,052 × 557; 1.2 MB
-
Biacore-english.svg 1,052 × 744; 200 KB
-
Biacore-francais.svg 1,052 × 744; 200 KB
-
Bilayer hydration profile-es.svg 648 × 634; 389 KB
-
Bilayer hydration profile.svg 691 × 676; 409 KB
-
Biological and technological scales compared-en.svg 1,062 × 755; 1.46 MB
-
Biological and technological scales compared-es.svg 1,062 × 755; 1.52 MB
-
Biological and technological scales compared-fr.svg 1,062 × 755; 1.46 MB
-
Biological and technological scales compared-mk.svg 1,062 × 755; 1.59 MB
-
Biological and technological scales compared-ru.svg 1,062 × 755; 1.51 MB
-
Biological clock human as.svg 1,200 × 620; 558 KB
-
Biological clock human-ar.svg 1,280 × 661; 982 KB
-
Biological clock human-el.svg 1,200 × 620; 574 KB
-
Biological clock human-fr.svg 1,200 × 620; 577 KB
-
Biological clock human-gu.svg 1,080 × 608; 471 KB
-
Biological clock human-hi.svg 1,200 × 620; 635 KB
-
Biological clock human-hy.svg 512 × 265; 218 KB
-
Biological clock human-kn.svg 1,106 × 574; 514 KB
-
Biological clock human-mr.svg 1,200 × 620; 564 KB
-
Biological clock human-ru.svg 512 × 265; 244 KB
-
Biological clock human.svg 1,200 × 620; 981 KB
-
Biologie.svg 604 × 705; 192 KB
-
Biology disciplines.svg 761 × 716; 341 KB
-
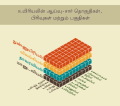
Biology tamil.svg 970 × 860; 476 KB
-
Biology.svg 671 × 523; 135 KB
-
Black lipid membrane.svg 709 × 590; 122 KB
-
Blending Inheritance.svg 900 × 675; 23 KB
-
Bobtail Squid Light Organ.svg 900 × 675; 66 KB
-
BreadWheatEvolution.svg 400 × 400; 20 KB
-
Brustansatz.svg 283 × 257; 16 KB
-
CaMV replication.svg 1,315 × 485; 74 KB
-
Cephalopod photophore structu.svg 1,052 × 744; 128 KB
-
Characteristics of life-ru.svg 512 × 358; 18 KB
-
Characteristics of life-uk.svg 512 × 358; 22 KB
-
Characteristics of life.svg 512 × 358; 91 KB
-
Chigger bite-ru.svg 393 × 464; 192 KB
-
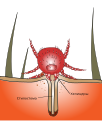
Chigger bite.svg 393 × 464; 174 KB
-
Chlamydomonas.svg 177 × 177; 14 KB
-
CHO-cycles cz.svg 2,384 × 1,684; 9 KB
-
Chronospecies.svg 724 × 1,099; 8 KB
-
Chronotype and age.svg 600 × 600; 31 KB
-
Chronotypen.svg 1,010 × 480; 335 KB
-
Circadian rhythm.svg 512 × 384; 63 KB
-
Circular Permutation In Proteins.svg 353 × 400; 15 KB
-
Cladistic species.svg 744 × 1,052; 11 KB
-
Clap and Fling 1- clap 1.svg 607 × 264; 21 KB
-
Clap and Fling 2- clap 2.svg 414 × 227; 19 KB
-
Clap and Fling 3 - clap 3.svg 377 × 295; 25 KB
-
Clap and Fling 4- fling 1.svg 365 × 208; 10 KB
-
Clap and Fling 5- fling 2.svg 461 × 219; 22 KB
-
Clap and Fling 6- fling 3.svg 587 × 281; 31 KB
-
ClO2pHkilling.svg 600 × 480; 70 KB
-
CollapsedtreeLabels-simplified, Animals emphasized.svg 800 × 528; 31 KB
-
Colloid Cyst.svg 512 × 237; 73 KB
-
Colonial Flagellate Hypothesis.svg 512 × 171; 203 KB
-
Color this sea world.svg 500 × 500; 416 KB
-
ComparaisonChatApattesnoires.svg 785 × 720; 303 KB
-
ComparaisonChatPiedsNoirs.svg 594 × 590; 342 KB
-
Complement alternative.svg 2,001 × 394; 582 KB
-
Complement leclassic.svg 2,028 × 628; 987 KB
-
Cos-huma-nivells-organitzacio-ca.svg 1,600 × 1,500; 458 KB
-
Cos-huma-nivells-organitzacio-en.svg 1,600 × 1,500; 454 KB
-
Cos-huma-nivells-organitzacio-es.svg 1,600 × 1,500; 460 KB
-
Cos-huma-nivells-organitzacio-fr.svg 1,600 × 1,500; 485 KB
-
Cos-huma-nivells-organitzacio-mut.svg 1,600 × 1,500; 434 KB
-
Counteracting shadow.svg 952 × 744; 152 KB
-
Countershading.svg 952 × 744; 14 KB
-
CrystalDrops.svg 530 × 1,322; 78 KB
-
Darwin's Pangenesis-ru.svg 912 × 297; 13 KB
-
Darwin's Pangenesis.svg 925 × 317; 13 KB
-
DCas9-Suntag activator.svg 4,600 × 3,966; 317 KB
-
DCas9-VPR activator.svg 4,600 × 3,966; 520 KB
-
Destruenten im Stoffkreislauf.svg 1,010 × 460; 7 KB
-
Diagram of mitosis.svg 477 × 337; 252 KB
-
Disruptive versus Distractive Camouflage Markings.svg 1,044 × 523; 118 KB
-
Dodder and its use of haustoria.svg 512 × 384; 141 KB
-
Dollo's law of irreversibility.svg 873 × 640; 18 KB
-
ECG Vector.svg 700 × 700; 11 KB
-
Effect of GC-content on the number of reads in NGS experiments.svg 317 × 123; 5.02 MB
-
Evolution of complexity.svg 1,665 × 1,452; 48 KB
-
Field of view.svg 630 × 405; 2 KB
-
Final stem cell differentiation (1).svg 512 × 362; 261 KB
-
Final stem cell differentiation es.svg 512 × 362; 277 KB
-
Final stem cell differentiation fi.svg 512 × 362; 277 KB
-
Final stem cell differentiation is.svg 512 × 362; 241 KB
-
Final stem cell differentiation mn.svg 512 × 362; 280 KB
-
Formation of Müllerian mimicry rings.svg 726 × 756; 36 KB
-
Fruchtdominanz Kernobst.svg 560 × 440; 22 KB
-
Gap gene expression.svg 200 × 150; 5 KB
-
Glucose-insulin-release-ar.svg 900 × 580; 17 KB
-
Glucose-insulin-release.svg 900 × 580; 8 KB
-
Gonium.svg 177 × 177; 96 KB
-
Graphic birthday rank USA.svg 765 × 205; 118 KB
-
Haeckel vs von Baer.svg 893 × 618; 34 KB
-
Haplodiploid Sex Determination in Honey Bees fr.svg 902 × 677; 4 KB
-
Haplodiploid Sex Determination in Honey Bees.svg 902 × 677; 4 KB
-
Hdl2.svg 698 × 474; 118 KB
-
Heatmap birthday rank USA.svg 410 × 540; 193 KB
-
Hermosto1.svg 308 × 360; 21 KB
-
Herring Gull population in France 1965-1998-fr.svg 1,100 × 1,100; 30 KB
-
Heterochrony.svg 1,052 × 744; 25 KB
-
High-density lipoproteins-pl.svg 720 × 526; 320 KB
-
High-density lipoproteins-ru.svg 720 × 526; 348 KB
-
Hilarappendix.svg 177 × 106; 18 KB
-
Hodgkin-Huxley - PT.svg 210 × 154; 5 KB
-
Hodgkin-Huxley.svg 512 × 363; 3 KB
-
HTNStudy2 hy.svg 1,535 × 922; 34 KB
-
HTNStudy2.svg 1,501 × 1,000; 33 KB
-
Hypertoon-hypotoon-isotoon.svg 410 × 250; 24 KB
-
Häme synthese.svg 2,020 × 620; 413 KB
-
Illustration of BAF values.svg 404 × 185; 195 KB
-
Immune Response.svg 512 × 384; 65 KB
-
Innate Immune cells.svg 497 × 1,164; 25 KB
-
IUCN Red List 2007 as.svg 800 × 394; 34 KB
-
IUCN Red List 2007 BN.svg 800 × 394; 143 KB
-
IUCN Red List 2007 cy.svg 800 × 394; 35 KB
-
IUCN Red List 2007 IT.svg 800 × 394; 33 KB
-
IUCN Red List 2007 mk.svg 800 × 394; 40 KB
-
IUCN Red List 2007 ms.svg 800 × 394; 35 KB
-
IUCN Red List 2007 pl.svg 800 × 394; 43 KB
-
IUCN Red List 2007.svg 800 × 394; 46 KB
-
Klasyfikacja zwierzat.svg 700 × 240; 22 KB
-
Knospendominanz Steinobst.svg 490 × 530; 30 KB
-
L-system-fractal.svg 307 × 704; 14 KB
-
L-tree nevit 059.svg 744 × 1,052; 50 KB
-
Lichen Cross Section Diagram.svg 512 × 282; 94 KB
-
Lichen cross section – heteromeric thallus.svg 516 × 532; 84 KB
-
Life symbols 48 x 146.svg 137 × 45; 509 KB
-
Life symbols.svg 744 × 1,052; 509 KB
-
Lifecycle diagram.svg 744 × 1,052; 55 KB
-
Limb bud.svg 850 × 496; 11 KB
-
Lock and key enzyme mechanism.svg 498 × 1,182; 18 KB
-
LPS-Assembly.svg 792 × 480; 61 KB
-
LPS-Transport.svg 792 × 572; 63 KB
-
MAPKpathway diagram.svg 295 × 920; 33 KB
-
Mass extinction timeline.svg 115 × 545; 23 KB
-
Maternal effect mRNAs-2.svg 350 × 225; 2 KB
-
Maternal effect mRNAs.svg 350 × 225; 2 KB
-
Mechanism imatinib.svg 432 × 268; 20 KB
-
MenstrualCycle - ru.svg 580 × 775; 320 KB
-
Metabolismo-secundario-fr.svg 704 × 612; 49 KB
-
Metabolismo-secundario.svg 704 × 612; 134 KB
-
Metabolites of maraviroc.svg 1,921 × 1,089; 210 KB
-
MHC Class 1(Traditional Chinese).svg 308 × 394; 4 KB
-
MHC Class 1.svg 308 × 394; 9 KB
-
MHC Class 2.svg 219 × 405; 10 KB
-
MHC expression.svg 3,069 × 2,523; 409 KB
-
MHC-I structure.svg 656 × 996; 121 KB
-
MHC1 antigen presentation.svg 602 × 317; 31 KB
-
MHC2.svg 461 × 348; 47 KB
-
Michelle Karam Parathyroid (2).svg 512 × 465; 143 KB
-
Micropredator Parasite Parasitoid Predator strategies compared.svg 1,857 × 648; 156 KB
-
Miles misra method.svg 744 × 1,052; 5 KB
-
Modern Synthesis Limits.svg 1,027 × 633; 42 KB
-
Modern Synthesis.svg 900 × 675; 32 KB
-
Monod 3.svg 859 × 504; 69 KB
-
Monod-Kinetik.svg 1,599 × 779; 28 KB
-
Monod.svg 1,052 × 1,488; 69 KB
-
Monod2.svg 859 × 504; 69 KB
-
Na-Glucose-Symport.svg 942 × 535; 158 KB
-
Niche construction in evolutionary time.svg 632 × 511; 103 KB
-
Notch signaling.svg 400 × 400; 13 KB
-
Notchccr.svg 500 × 465; 20 KB
-
Nrm ld.svg 1,000 × 1,000; 311 KB
-
Omics-en.svg 621 × 652; 14 KB
-
Omics-es.svg 512 × 537; 6 KB
-
Omics-fr.svg 649 × 652; 14 KB
-
On the pool (60 dots).svg 589 × 475; 6 KB
-
Oogenesis.svg 512 × 911; 30 KB
-
P1010946-drawing nevit 034.svg 663 × 736; 306 KB
-
Pair rule.svg 336 × 334; 8 KB
-
Parakaryon myojinensis drawing.svg 1,038 × 500; 49 KB
-
Parasitoid Strategies Koinobiont Compared to Idiobiont.svg 1,200 × 675; 36 KB
-
Parasitoid strategy compared with Parasite and Predator.svg 1,200 × 675; 25 KB
-
Parathyroid Hormone Negative Feedback.svg 512 × 465; 131 KB
-
Pasteuria ramosa LifeCycle DVizoso.svg 579 × 500; 226 KB
-
Peripheral vision.svg 600 × 577; 2 KB
-
Phototrophic Response to Stimulus.svg 512 × 412; 37 KB
