
Category:2014 maps of Europe
Temperate regions: North America · South America · Africa · Europe · Asia · Oceania – Polar regions: – Other regions:
English: 2014 maps of Europe
Español: Mapas de Europa en 2014
Suomi: Euroopan kartat vuodelta 2014
Română: Hărți ale Europei din 2014
Subcategories
This category has the following 29 subcategories, out of 29 total.
B
- 2014 maps of Belarus (13 F)
- 2014 maps of Belgium (7 F)
D
E
- 2014 maps of Estonia (1 F)
F
- 2014 maps of France (17 F)
G
- 2014 maps of Georgia (8 F)
- 2014 maps of Greece (17 F)
I
- 2014 maps of Iceland (6 F)
- 2014 maps of Ireland (5 F)
- 2014 maps of Italy (13 F)
L
- 2014 maps of Latvia (3 F)
M
- 2014 maps of Moldova (12 F)
- 2014 maps of Montenegro (3 F)
N
- 2014 maps of Norway (5 F)
R
- 2014 maps of Russia (7 F)
S
- 2014 maps of Serbia (17 F)
- 2014 maps of Spain (559 F)
- 2014 maps of Sweden (6 F)
- 2014 maps of Switzerland (21 F)
T
- Tour de France maps 2014 (5 F)
U
Media in category "2014 maps of Europe"
The following 100 files are in this category, out of 100 total.
-
 2014 European Men's Handball Championship.svg 680 × 520; 363 KB
-
 2014 European Men-s Handball Championship Result.png 1,329 × 1,000; 342 KB
-
 2014 European Women's Handball Championship Results.svg 841 × 731; 234 KB
-
 2014 European Women's Handball Championship.svg 841 × 731; 229 KB
-
 2014 see flood map.png 1,000 × 692; 122 KB
-
 2014 UEFA U-19 European Championship map.svg 610 × 457; 356 KB
-
 2014 UEFA Women's Under-17 Championship map.svg 610 × 457; 379 KB
-
 2014 world cup qualification (UEFA).png 2,064 × 1,269; 91 KB
-
 Atur a Europa.png 1,236 × 1,245; 60 KB
-
 Balkan floods May 2014.svg 850 × 600; 239 KB
-
 Celtic Sea and Bay of Biscay bathymetric map-en.svg 3,479 × 3,805; 4.93 MB
-
 Crimean referendum 2014 (alternate colours).svg 532 × 353; 239 KB
-
 Crimean referendum 2014 Voter turnout.png 1,867 × 1,231; 299 KB
-
 Crimean referendum 2014.svg 532 × 353; 243 KB
-
 Croatia total fertility rate by region 2014.png 1,097 × 1,062; 258 KB
-
 Czech Republic total fertility rate by region 2014.png 1,004 × 611; 108 KB
-
 Death-rate-by-source-from-indoor-air-pollution,Europe,2014.svg 850 × 714; 157 KB
-
 Death-rate-from-opioid-use-who,Europe,2014.svg 850 × 600; 152 KB
-
 Death-rate-smoking,Europe,2014.svg 850 × 699; 156 KB
-
 Density of Population in EU 2014-it.svg 609 × 600; 2.15 MB
-
 Density of Population in EU 2014.svg 609 × 600; 2.15 MB
-
 ECDM 20140131 EasternCentralEurope SevereWeather.pdf 1,625 × 1,125; 466 KB
-
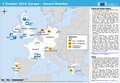
 ECDM 20140210 Europe SevereWeather.pdf 1,625 × 1,125; 635 KB
-
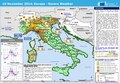
 ECDM 20141007 SevereWeatherEurope.pdf 1,625 × 1,125; 339 KB
-
 ECDM 20141110 CentralEurope SevereWeather 02.pdf 1,625 × 1,125; 644 KB
-
 EU Trawlers.png 819 × 956; 767 KB
-
 EU Unemployment.svg 512 × 507; 187 KB
-
 Europäische Wirtschafts- und Währungsunion-2014.svg 680 × 520; 374 KB
-
 Europäische Wirtschafts- und Währungsunion-2014.tif 680 × 520; 1.01 MB
-
 Eurozone map-2014.svg 680 × 520; 391 KB
-
 Euthanasia in Europe.png 2,000 × 1,554; 1.2 MB
-
 Federal State of New Russia.svg 815 × 1,075; 688 KB
-
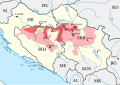
 Flood in Serbia 2014 Map-sr.svg 727 × 1,041; 513 KB
-
 France total fertility rate by region 2014.png 2,000 × 1,922; 729 KB
-
 High Speed Railroad Map of Europe 2014.svg 800 × 600; 685 KB
-
 Hungary total fertility rate by region 2014.png 1,210 × 746; 177 KB
-
 Krim 2014 de.svg 665 × 441; 103 KB
-
 Krim 2014 mk.svg 665 × 441; 232 KB
-
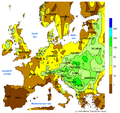
 Latin Europe.png 1,187 × 1,103; 224 KB
-
 Le top 10 des rues les plus chères de Paris, 2014 - Le Parisien.svg 512 × 293; 130 KB
-
 Life-expectancy,Europe,2014.svg 850 × 691; 156 KB
-
 Macedonia total fertility rate by region 2014.png 1,368 × 1,133; 200 KB
-
 MapEuropeSmall WattPerCapita 2014.svg 401 × 420; 105 KB
-
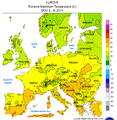 NWS-NOAA Europe Maximum Temperature (C) NOV 2-8, 2014.png 2,434 × 2,488; 276 KB
-
 NWS-NOAA Europe Maximum Temperature (C) NOV 9-15, 2014.png 2,428 × 2,488; 272 KB
-
 NWS-NOAA Europe Percentage of Normal Precipitation NOV 2014 cropped.png 1,812 × 1,243; 171 KB
-
 NWS-NOAA Europe Percentage of Normal Precipitation NOV 2014.png 2,434 × 2,488; 325 KB
-
 NWS-NOAA Europe Temperature Anomaly (C) MAY 11-17, 2014.png 2,400 × 2,250; 196 KB
-
 NWS-NOAA Europe Temperature Anomaly (C) NOV 2-8, 2014.png 2,425 × 2,488; 279 KB
-
 NWS-NOAA Europe Temperature Anomaly (C) NOV 2014.png 2,437 × 2,491; 267 KB
-
 NWS-NOAA Europe Temperature Anomaly (C) NOV 30-DEZ 6, 2014.png 2,434 × 2,488; 294 KB
-
 NWS-NOAA Europe Temperature Anomaly (C) NOV 9-15, 2014.png 2,431 × 2,491; 279 KB
-
 NWS-NOAA Europe Total Percipitation MAY 11-17, 2014.png 2,400 × 2,250; 217 KB
-
 NWS-NOAA Europe Total Percipitation NOV 2-8, 2014.png 2,425 × 2,485; 286 KB
-
 NWS-NOAA Europe Total Percipitation NOV 2014.png 2,428 × 2,488; 289 KB
-
 NWS-NOAA Europe Total Percipitation NOV 30-DEZ 6, 2014.png 2,431 × 2,485; 280 KB
-
 NWS-NOAA Europe Total Percipitation NOV 9-15, 2014.png 2,425 × 2,488; 288 KB
-
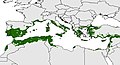 Olive niche.jpg 744 × 403; 169 KB
-
 PAT - Albania.gif 800 × 1,025; 320 KB
-
 PAT - Andorra.gif 920 × 920; 309 KB
-
 PAT - Austria.gif 975 × 860; 363 KB
-
 PAT - Belarus.gif 800 × 1,035; 218 KB
-
 PAT - Bosnia-Herzegovina.gif 890 × 950; 363 KB
-
 PAT - Bulgaria.gif 920 × 920; 298 KB
-
 PAT - Croatia.gif 860 × 975; 286 KB
-
 PAT - Czech Republic.gif 920 × 920; 324 KB
-
 PAT - Finland.gif 800 × 1,060; 304 KB
-
 PAT - France.gif 920 × 920; 256 KB
-
 PAT - Gibraltar.gif 860 × 975; 158 KB
-
 PAT - Hungary.gif 920 × 920; 315 KB
-
 PAT - Ireland.gif 835 × 1,035; 183 KB
-
 PAT - Latvia.gif 940 × 900; 164 KB
-
 PAT - Lithuania.gif 830 × 1,000; 166 KB
-
 PAT - Luxembourg.gif 830 × 1,035; 320 KB
-
 PAT - Macedonia.gif 860 × 975; 423 KB
-
 PAT - Moldova.gif 800 × 1,090; 308 KB
-
 PAT - Monaco.gif 975 × 860; 214 KB
-
 PAT - Montenegro.gif 860 × 1,090; 436 KB
-
 PAT - Norway.gif 800 × 1,035; 247 KB
-
 PAT - Poland.gif 800 × 1,035; 271 KB
-
 PAT - Portugal.gif 750 × 1,150; 266 KB
-
 PAT - Romania.gif 890 × 950; 348 KB
-
 PAT - San Marino.gif 800 × 800; 158 KB
-
 PAT - Serbia.gif 860 × 975; 397 KB
-
 PAT - Slovakia.gif 1,035 × 800; 338 KB
-
 PAT - Slovenia.gif 920 × 920; 372 KB
-
 PAT - Switzerland.gif 920 × 920; 486 KB
-
 PAT - Vatican City.gif 800 × 800; 142 KB
-
 Poland total fertility rate by region 2014.png 862 × 838; 141 KB
-
 Porducción de olivas.PNG 1,344 × 772; 63 KB
-
 Precipitation Map of Europe (May 10-18, 2014).svg 393 × 328; 826 KB
-
 Rainbow Europe Map 2014.svg 1,401 × 1,198; 1.46 MB
-
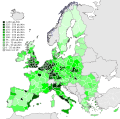
 Share of arable land which is organic, OWID.svg 850 × 600; 167 KB
-
 Slovakia total fertility rate by region 2014.png 1,032 × 533; 104 KB
-
 Türkvizyon 2014 map.svg 1,000 × 665; 599 KB
-
 UEFA Futsal Euro 2014 Belgium.png 2,000 × 1,498; 433 KB
-
 UEFA Futsal Euro 2014.svg 610 × 457; 370 KB
-
 Unemployment European Union 2014M09.svg 454 × 450; 385 KB
-
 Краіны-ўдзельніцы ЧС-2014 па гандболе.svg 680 × 520; 361 KB
-
 Сеть жд Финляндии 2014.jpg 1,396 × 2,062; 2.66 MB


.png)


.svg)


_NOV_2-8,_2014.png)
_NOV_9-15,_2014.png)


_MAY_11-17,_2014.png)
_NOV_2-8,_2014.png)
_NOV_2014.png)
_NOV_30-DEZ_6,_2014.png)
_NOV_9-15,_2014.png)


.svg)


