Category:XY plots
Jump to navigation
Jump to search
Subcategories
This category has the following 16 subcategories, out of 16 total.
A
- Acoustic weighting filters (11 F)
B
- BJT characteristic curves (50 F)
D
F
- Fletcher loudness contours (27 F)
H
L
P
Q
R
- Refractive index plots (64 F)
S
T
W
Y
Pages in category "XY plots"
This category contains only the following page.
Media in category "XY plots"
The following 200 files are in this category, out of 269 total.
(previous page) (next page)-
03days 28rotpermonth.png 800 × 696; 10 KB
-
07-WFF Low Cost Access Diagram.jpg 488 × 440; 24 KB
-
Absement displacement velolcity500miles bigger boundingbox.svg 630 × 1,004; 49 KB
-
Absement displacement velolcity500miles.svg 200 × 125; 51 KB
-
Access-Delay.jpg 718 × 527; 87 KB
-
AMATYC logo.jpg 2,048 × 938; 47 KB
-
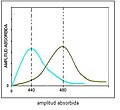
Amplitud absorbida.JPG 312 × 285; 12 KB
-
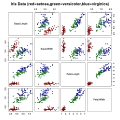
Anderson's Iris data set.png 1,198 × 1,198; 240 KB
-
Anticipo d'accensione.gif 750 × 525; 18 KB
-
AQL IQL RQL.png 1,000 × 719; 28 KB
-
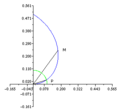
Archimedspir2.png 305 × 284; 1 KB
-
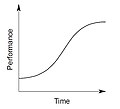
Ascending graph.png 650 × 419; 16 KB
-
BCG Matrix with cashflows-small.png 459 × 337; 109 KB
-
BCG Matrix with products-small.png 459 × 325; 77 KB
-
Beispill vun enger Funktioun.jpg 560 × 421; 17 KB
-
Biztanleri bilbo1.jpg 570 × 364; 61 KB
-
Bremsen mit der Sägezahnmethode.png 1,537 × 855; 56 KB
-
Bremskurven.PNG 1,000 × 600; 20 KB
-
Brezina equation.jpg 1,024 × 480; 46 KB
-
ButterworthFilter40Percent5thOrder-de.svg 670 × 590; 243 KB
-
Cache,missrate.png 453 × 288; 15 KB
-
Calculus graphing exercise 1.png 445 × 260; 4 KB
-
Calculus graphing exercise 2.png 429 × 254; 3 KB
-
Carothers lineares AB system.png 748 × 445; 15 KB
-
CarothersLinearesAABBSystem.png 600 × 400; 15 KB
-
CarothersNichtlinearesABSystem.png 600 × 400; 16 KB
-
CDM Baseline.JPG 991 × 461; 53 KB
-
Ch04ex003a.png 671 × 671; 9 KB
-
Charles' Law Graph.png 465 × 326; 29 KB
-
Charles's law graph.png 977 × 600; 15 KB
-
Chart MPG to L-100km v2009-10-08.svg 1,313 × 910; 223 KB
-
Chart MPG to Litre-100km.svg 778 × 470; 36 KB
-
Computer graph created by trial and error.jpg 497 × 500; 44 KB
-
Constant signal decomposition.png 872 × 255; 4 KB
-
Contracción del eje de las Y.jpg 720 × 540; 13 KB
-
Contre exemple Rolle.svg 470 × 350; 9 KB
-
Coord system.png 700 × 486; 3 KB
-
Coses rares.JPG 808 × 479; 29 KB
-
Courbe simple.png 165 × 130; 2 KB
-
Creneau.png 316 × 154; 5 KB
-
CTC - Harmony Figure 1.PNG 414 × 345; 10 KB
-
CTC - Harmony Figure 2.PNG 426 × 345; 10 KB
-
CTC - Harmony Figure 3.PNG 458 × 347; 10 KB
-
Cube root x outputSimp.png 1,280 × 908; 12 KB
-
Curve anticipo analogiche.svg 1,024 × 390; 3 KB
-
Cut Detection-es.svg 713 × 346; 24 KB
-
Cut Detection.png 713 × 346; 35 KB
-
Cycloides.png 400 × 400; 11 KB
-
DesirabilitySignalNoise.png 205 × 150; 1 KB
-
DesirabilityYmoy.png 202 × 158; 1 KB
-
DiagramaInversaoTermica.jpg 360 × 225; 12 KB
-
Distribucion ameni.JPG 740 × 395; 17 KB
-
Distribucion amenidad2.JPG 742 × 445; 22 KB
-
Distribucion firma ameni.JPG 745 × 452; 23 KB
-
Domain codomain.png 1,365 × 1,882; 80 KB
-
EB1911 Railways - Engine Efficiency Curves.jpg 833 × 547; 132 KB
-
EB1911 Railways - indicator diagram.jpg 612 × 297; 53 KB
-
EB1911 Railways - Vehicle and Engine Resistance.jpg 868 × 602; 94 KB
-
ECE weekly 247 Births per year.png 463 × 496; 9 KB
-
Encadrement courbe 1.png 819 × 460; 3 KB
-
Encadrement courbe 2.png 819 × 460; 3 KB
-
Equilibrio amenidades.JPG 469 × 480; 16 KB
-
Ertragsgesetz.svg 857 × 505; 10 KB
-
Ertragsgesetzliche Produktionsfunktion.svg 465 × 457; 4 KB
-
Esovia.JPG 449 × 407; 9 KB
-
Example of plot using AWE.png 1,004 × 669; 50 KB
-
Extrema5.gif 388 × 371; 3 KB
-
Firstsynchfunction.jpg 273 × 171; 3 KB
-
Fretboard-radii-graph.svg 311 × 281; 12 KB
-
Function behavior.gif 500 × 500; 232 KB
-
Funzione porta (tempo e frequenza).png 518 × 185; 2 KB
-
Gammakurve.gif 400 × 400; 6 KB
-
Gate convolution (frequency).png 362 × 297; 2 KB
-
Gate convolution (triangular case).png 280 × 196; 2 KB
-
Gate convolution.png 494 × 293; 3 KB
-
Gec kalan ivme.jpg 403 × 331; 11 KB
-
Gradient of a line in coordinates from -12x+2 to +12x+2.gif 600 × 600; 1.23 MB
-
Grafico del punto fijo.JPG 512 × 384; 17 KB
-
Gràfica del arcsinus.png 360 × 360; 11 KB
-
HDD read-write benchmark using GNOME Disks.png 1,280 × 967; 134 KB
-
Hendys Law.jpg 460 × 345; 59 KB
-
Hledani.JPG 450 × 438; 11 KB
-
Houtman Abrolhos sea temperature and salinity.png 480 × 480; 7 KB
-
I-5.png 952 × 609; 33 KB
-
I-7.png 1,134 × 619; 31 KB
-
IASYM.jpg 970 × 621; 53 KB
-
Iglesias orientales católicas grandes.PNG 872 × 546; 18 KB
-
Iglesias orientales católicas pequeñas.PNG 873 × 546; 17 KB
-
Image 12 eilco.png 420 × 267; 12 KB
-
Image 13 eilco.png 409 × 255; 11 KB
-
Image 14 eilco.png 429 × 265; 9 KB
-
Image 15 eilco.png 417 × 254; 12 KB
-
Image 16 eilco.png 421 × 256; 8 KB
-
Image 17 eilco.png 356 × 199; 6 KB
-
Image 18 eilco.png 374 × 205; 10 KB
-
Image 19 courbe.png 456 × 301; 11 KB
-
Image 20 courbe.png 467 × 321; 11 KB
-
Image 21 courbe.png 469 × 305; 10 KB
-
Image equation.png 759 × 259; 13 KB
-
Integral as region under curve.png 782 × 685; 9 KB
-
Inventory control - reorder point and service level.png 450 × 334; 3 KB
-
IQ curve (2).svg 600 × 480; 9 KB
-
IQ curve.svg 600 × 480; 9 KB
-
Iris dataset scatterplot.svg 749 × 749; 678 KB
-
Irish GDPDebt Ratio Chart.jpg 500 × 360; 56 KB
-
J-3.png 1,134 × 619; 32 KB
-
J-4.png 1,134 × 619; 30 KB
-
J-5.png 1,134 × 619; 34 KB
-
J-6.png 1,134 × 619; 36 KB
-
J-7.png 1,134 × 619; 34 KB
-
K-5.png 1,134 × 619; 32 KB
-
K-7.png 1,134 × 619; 31 KB
-
K-8.png 1,134 × 619; 34 KB
-
K-9.png 1,134 × 619; 33 KB
-
Kantavierre alkoholi olut.png 621 × 405; 20 KB
-
Komplexni rovina.png 256 × 256; 3 KB
-
Kvalitetsmätning.png 1,440 × 900; 50 KB
-
L-3.png 1,134 × 619; 33 KB
-
L-4.png 1,134 × 619; 31 KB
-
L-6.png 1,134 × 619; 33 KB
-
L-7.png 1,134 × 619; 37 KB
-
L-8.png 1,134 × 619; 36 KB
-
L-9.png 1,134 × 619; 29 KB
-
Lanchester Figure2.png 1,021 × 906; 90 KB
-
Lanchester Figure6.png 471 × 287; 7 KB
-
LegendreRational1.png 856 × 572; 24 KB
-
LegendreRational2.png 866 × 543; 19 KB
-
Lemniskate Kruemmungsfunktion Animated.gif 509 × 293; 710 KB
-
LeverRule.svg 248 × 177; 16 KB
-
Levy distributionPDF.png 1,300 × 975; 128 KB
-
Linearchirp.png 1,250 × 875; 95 KB
-
Lissajous-Kurve Kruemmungsfunktion Animated.gif 495 × 270; 717 KB
-
Log Wilkinson polynomial.png 2,000 × 1,400; 422 KB
-
Log2approx.png 574 × 280; 11 KB
-
Longishtailwikigraph.png 816 × 449; 42 KB
-
Löhne sauerland.PNG 250 × 244; 5 KB
-
M-3.png 1,134 × 619; 31 KB
-
M-4.png 1,134 × 619; 33 KB
-
M-5.png 1,134 × 619; 34 KB
-
M-6.png 1,134 × 619; 39 KB
-
Members Lyoness International AG.png 908 × 486; 11 KB
-
Members.JPG 833 × 379; 34 KB
-
Misakrajicek positie070611.png 800 × 500; 13 KB
-
Mplwp 0 8 15.svg 600 × 400; 27 KB
-
Multiple plots on a single graph.jpg 560 × 420; 30 KB
-
N6.png 1,134 × 619; 36 KB
-
N7.png 1,134 × 619; 32 KB
-
N9.png 1,134 × 619; 35 KB
-
Negative differential resistance.png 900 × 900; 42 KB
-
Neilsche Parabel.png 250 × 300; 3 KB
-
Newbury election results (smaller).png 320 × 160; 3 KB
-
NewburyConstituencyResults1959-2005.png 634 × 383; 13 KB
-
NRZcode.png 256 × 128; 753 bytes
-
Nuage1.png 311 × 205; 2 KB
-
Nullátmenet feszültség-idő diagramon.svg 576 × 432; 60 KB
-
NYMEX Light Sweet Crude Oil prices from 2005 to 2008-12-02.svg 413 × 758; 69 KB
-
Ohnos-lexical-law-fig1.png 509 × 399; 12 KB
-
Ohnos-lexical-law-fig2.png 460 × 541; 18 KB
-
Oil consumption per day by region from 1980 to 2006.svg 600 × 450; 204 KB
-
Oil depletion per country.jpg 612 × 792; 70 KB
-
Oil price rises - May 22, 2008.png 441 × 371; 11 KB
-
Olympe-sites.jpg 1,280 × 695; 227 KB
-
OPgrowth-RonaldB.jpg 856 × 585; 52 KB
-
Ordinariatos sin rito propio.PNG 873 × 546; 16 KB
-
PcaIdea.png 700 × 700; 4 KB
-
Pente.gif 453 × 493; 4 KB
-
Perfil Ribera Salada.jpg 954 × 502; 166 KB
-
Periodic gate functions.png 915 × 169; 2 KB
-
Phasenschieben.png 1,600 × 1,024; 65 KB
-
PiquageCollecteur fig 10.JPG 632 × 517; 30 KB
-
PiquageCollecteur fig 9.JPG 489 × 382; 10 KB
-
Piston pump delivery.jpg 609 × 221; 15 KB
-
Plot of (-x exponent 2 plus 4x-3)exponent(half).png 1,268 × 573; 5 KB
-
Plot-Linear-regres-ex01.3.png 503 × 358; 35 KB
-
Polaraero.png 2,362 × 2,362; 409 KB
-
Polynomial.png 499 × 346; 8 KB
-
Potential.gif 958 × 612; 8 KB
-
PPV-prev.png 305 × 224; 2 KB
-
ProduccionMineralCobre 1900 2004.png 968 × 602; 16 KB
-
ProduccionMineralCobre Chile 1985 2004.png 968 × 602; 13 KB
-
Qqnormcorr.png 556 × 555; 5 KB
-
Quadrotor yaw torque.png 325 × 337; 34 KB
-
R2 9 plot 2.jpg 560 × 420; 18 KB
-
Raizinfty.svg 512 × 512; 63 KB
-
REF 1.png 874 × 546; 11 KB
-
REF 2.png 874 × 546; 12 KB
-
REF 4.png 833 × 512; 29 KB
-
Restrike cap switching.JPG 970 × 601; 61 KB
-
RetePerf.png 541 × 355; 11 KB
-
RfA Kalan@ruwiki voters.svg 514 × 305; 24 KB
-
Ris1.jpg 628 × 403; 30 KB
-
RZcode.png 256 × 128; 471 bytes
-
Sag.png 284 × 116; 3 KB
-
Sampled.held.signal.png 302 × 193; 7 KB
-
Sampled.signal.png 302 × 194; 7 KB
-
Schematic representation of the 3C-based approaches.svg 218 × 215; 17 KB
-
Schnitterkennung Thresholding.png 337 × 239; 18 KB
-
SeaIce 2002-05 cmp 1979-2000.png 1,160 × 710; 65 KB
-
Secante-calculo.gif 823 × 586; 6 KB
-
SEDequation1.jpg 1,024 × 759; 101 KB


