
Category:SVG x-y functions
Rename of Category:SVG Función xy
Subcategories
This category has the following 15 subcategories, out of 15 total.
S
- SVG function Cu (19 F)
- SVG functions 01 x-y (17 F)
- SVG Linear function (139 F)
- SVG Scalar function (33 F)
- SVG Singularity (140 F)
- SVG Statistics (44 F)
- SVG trigonometric x-y functions (213 F)
Media in category "SVG x-y functions"
The following 134 files are in this category, out of 134 total.
-
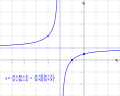
 1 to minus 2.svg 1,300 × 975; 13 KB
-
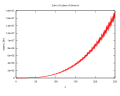
 2 example.svg 736 × 496; 101 KB
-
 Absolute value composition.svg 768 × 996; 2 KB
-
 Aire sous la courbe.svg 1,618 × 1,000; 6 KB
-
 Algebra1 fnz fig042 par.svg 195 × 160; 19 KB
-
 AnaFun 001.svg 1,500 × 1,200; 82 KB
-
 Ax2 shift.svg 500 × 400; 16 KB
-
 CarmichaelLambda.svg 575 × 431; 232 KB
-
 Carmicheal+Euler-function.svg 768 × 740; 102 KB
-
 Conchoid of deSluze.svg 560 × 560; 4 KB
-
 Coth sech csch.svg 520 × 520; 18 KB
-
 Crooked egg curve.svg 560 × 560; 2 KB
-
 Cusp.svg 330 × 430; 3 KB
-
 DGL y-eq-dy.svg 400 × 520; 5 KB
-
 Differential.svg 331 × 135; 60 KB
-
 Divisor cube.svg 600 × 480; 8 KB
-
 Divisor square.svg 600 × 480; 8 KB
-
 Divisor.svg 600 × 480; 4 KB
-
 Edward-curves.svg 500 × 500; 10 KB
-
 Epsilon-delta limit.svg 1,102 × 828; 19 KB
-
 Error function.svg 480 × 240; 19 KB
-
 Example for addition of functions.svg 487 × 367; 33 KB
-
 Exp e.svg 600 × 550; 6 KB
-
 Extrema example de.svg 510 × 380; 2 KB
-
 Extrema example es.svg 510 × 380; 3 KB
-
 Family of parabolas.svg 600 × 480; 3 KB
-
 Floor function and its antiderivatives.svg 720 × 540; 32 KB
-
 Forgetting curve decline.svg 307 × 244; 7 KB
-
 ForgettingCurve.svg 277 × 237; 8 KB
-
 FuncionLineal00.svg 800 × 800; 44 KB
-
 FuncionLineal01.svg 512 × 512; 2 KB
-
 FuncionLineal01B.svg 512 × 512; 4 KB
-
 FuncionLineal02.svg 800 × 800; 16 KB
-
 FuncionLineal03.svg 800 × 800; 33 KB
-
 FuncionLineal04.svg 800 × 800; 33 KB
-
 FuncionLineal05.svg 800 × 800; 35 KB
-
 FuncionLineal06.svg 800 × 800; 33 KB
-
 FuncionLineal07.svg 800 × 800; 33 KB
-
 FuncionLineal08.svg 800 × 800; 33 KB
-
 FuncionLineal09.svg 800 × 800; 33 KB
-
 Función 100.svg 1,100 × 800; 25 KB
-
 Función circular 001.svg 600 × 600; 8 KB
-
 Función constante 01.svg 1,000 × 1,000; 18 KB
-
 Función Continua 044.svg 1,000 × 800; 15 KB
-
 Función Continua 050.svg 1,000 × 800; 34 KB
-
 Función Continua 051.svg 1,000 × 800; 35 KB
-
 Función cuadrática 01.svg 1,000 × 1,000; 16 KB
-
 Función cuadrática 02.svg 1,000 × 1,000; 16 KB
-
 Función cuadrática 03.svg 1,000 × 1,000; 16 KB
-
 Función cuadrática 04.svg 1,000 × 1,000; 16 KB
-
 Función cuadrática 05.svg 1,000 × 1,000; 16 KB
-
 Función cuadrática 11.svg 1,000 × 1,000; 16 KB
-
 Función cuadrática 12.svg 1,000 × 1,000; 16 KB
-
 Función cuadrática 13.svg 1,000 × 1,000; 16 KB
-
 Función impar 01.svg 1,000 × 800; 18 KB
-
 Función par 01.svg 1,000 × 800; 17 KB
-
 Función Periódica.svg 2,000 × 1,400; 13 KB
-
 Función s 01.svg 1,500 × 1,200; 50 KB
-
 Función sigmoide 01.svg 800 × 600; 65 KB
-
 Función sigmoide 02.svg 800 × 600; 68 KB
-
 Funkcja Carmichaela.svg 800 × 800; 86 KB
-
 Gjl-t(x).svg 700 × 350; 36 KB
-
 Gompertz-a.svg 680 × 400; 23 KB
-
 Gompertz-b.svg 680 × 400; 24 KB
-
 Gompertz-c.svg 680 × 400; 23 KB
-
 Graph of cubic polynomial.svg 320 × 480; 2 KB
-
 Graph of function 1 to minus 1 in Neighbourhood of zero.svg 1,300 × 975; 12 KB
-
 Hipografo.svg 744 × 1,052; 27 KB
-
 Int function.svg 1,000 × 1,000; 16 KB
-
 Integral as region under curve.svg 750 × 700; 1 KB
-
 Integral-area-under-curve.svg 1,618 × 1,000; 8 KB
-
 Isolated-point.svg 270 × 360; 3 KB
-
 Kartesisches-Blatt.svg 440 × 440; 5 KB
-
 Koordinaten xy mit Netz.svg 600 × 600; 28 KB
-
 Koordinaten xy ohne Netz.svg 600 × 600; 28 KB
-
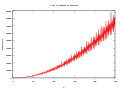
 Linear-chirp.svg 512 × 343; 19 KB
-
 Liniar.svg 702 × 497; 2 KB
-
 Ln series positive real.svg 750 × 500; 9 KB
-
 Log-semilog.svg 600 × 480; 29 KB
-
 Log4.svg 575 × 500; 23 KB
-
 Mercator series.svg 480 × 480; 6 KB
-
 Mplwp xlnx.svg 600 × 400; 25 KB
-
 Mplwp xpowx.svg 600 × 400; 23 KB
-
 Nonaffine collineation ofQsqrt2.svg 428 × 435; 12 KB
-
 Normal distribution.svg 480 × 180; 12 KB
-
 Oil world price from 1998 to 2008 Oct 31.svg 805 × 586; 78 KB
-
 Optimum.svg 1,052 × 744; 4 KB
-
 Qqnormcorr.png 556 × 555; 5 KB
-
 Quadrifolium-comma decimals.svg 560 × 560; 5 KB
-
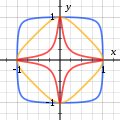
 Quadrifolium.svg 560 × 560; 3 KB
-
 Rational Elliptic Function (abs, n=3, x=(0,5)).svg 720 × 460; 84 KB
-
 Rational Elliptic Function (abs, n=4, x=(0,5)).svg 720 × 460; 80 KB
-
 Rational Elliptic Functions (n=1,2,3,4, x=--1,1-).svg 720 × 460; 86 KB
-
 Rational Elliptic Functions (xi varied, x=(-1,1)).svg 720 × 460; 96 KB
-
 Recta y=2+x.svg 1,000 × 1,000; 4 KB
-
 Rectangular function.svg 840 × 580; 3 KB
-
 Regla de tres.svg 800 × 800; 18 KB
-
 Relación directa.svg 1,000 × 1,000; 28 KB
-
 Relación inversa.svg 1,000 × 1,000; 27 KB
-
 Root-2-3-5-loglog.svg 640 × 400; 23 KB
-
 Rotated ellipse bg red.svg 320 × 320; 3 KB
-
 Rotated ellipse.svg 320 × 320; 3 KB
-
 Rownanie normalne prostej.svg 425 × 425; 19 KB
-
 Rownanie odcinkowe.svg 283 × 283; 14 KB
-
 Rownanie parametryczne prostej.svg 390 × 301; 15 KB
-
 Saddle-pathologic.svg 500 × 300; 15 KB
-
 Secante calculo.svg 823 × 586; 4 KB
-
 Semicubic-Parabolas.svg 340 × 480; 4 KB
-
 Semicubical parabola.svg 512 × 788; 49 KB
-
 Si sinc.svg 670 × 533; 31 KB
-
 Sigma function.svg 600 × 480; 7 KB
-
 Sigmoid-function-2.svg 900 × 414; 60 KB
-
 SignFunction.svg 359 × 285; 15 KB
-
 Signum function.svg 248 × 199; 1 KB
-
 Signum.svg 150 × 100; 5 KB
-
 Simple inverse relationship chart.svg 660 × 584; 25 KB
-
 Sine cosine integral.svg 512 × 384; 37 KB
-
 Sinh cosh.svg 312 × 500; 15 KB
-
 Sistema y=2-x i y=x+1.svg 1,000 × 1,000; 4 KB
-
 Spacings.svg 324 × 235; 73 KB
-
 Sqrt-plot-doppellog.svg 840 × 480; 16 KB
-
 Square root 0 25.svg 535 × 278; 20 KB
-
 Square-root function.svg 440 × 520; 2 KB
-
 Squareroot-0-9-metapost.svg 600 × 374; 18 KB
-
 Sucesión 001.svg 1,000 × 1,000; 54 KB
-
 Tanc.svg 640 × 480; 31 KB
-
 Taylorpolynom-sin.svg 476 × 228; 43 KB
-
 Tridente de Newton.svg 661 × 808; 74 KB
-
 X Cubed.svg 510 × 650; 1 KB
-
 X raised by x.svg 240 × 280; 8 KB
-
 X-dot-absx.svg 510 × 650; 1 KB
-
 X2+X+1.svg 300 × 300; 1 KB
-
 Y^x = x^y.svg 480 × 480; 185 KB
-
 最小正同界角與最大負同界角.svg 1,591 × 1,295; 128 KB


.svg)


).svg)
).svg)
.svg)
).svg)


