Category:Transcriptome
Jump to navigation
Jump to search
set of all RNA molecules in one cell or a population of cells | |||||
| Upload media | |||||
| Subclass of | |||||
|---|---|---|---|---|---|
| |||||
Media in category "Transcriptome"
The following 26 files are in this category, out of 26 total.
-
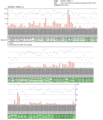
CCDC177 NCBI Geo Profile GDS596.png 1,258 × 1,460; 655 KB
-
Differential Expression in Testis and Liver Transcriptomes from Four Species of Peromyscus (Rodentia - Cricetidae).pdf 1,239 × 1,652, 12 pages; 981 KB
-
Efficient-Differentiation-of-Embryonic-Stem-Cells-into-Mesodermal-Precursors-by-BMP-Retinoic-Acid-pone.0036405.s001.ogv 3 min 19 s, 480 × 360; 49.48 MB
-
NCBI GeoProfiles expression data for QSER1.png 2,560 × 340; 31 KB
-
Spatial Transcriptomics Overview.png 1,403 × 2,100; 483 KB
-
Srna-seq-graph.png 2,023 × 670; 70 KB
-
Srna-seq-pipeline.png 1,054 × 339; 82 KB
-
Summary comparison of transcriptomic methods.png 9,565 × 3,121; 620 KB
-
Summary of RNA Microarray-ru.svg 1,020 × 858; 69 KB
-
Summary of RNA Microarray.png 3,095 × 2,611; 191 KB
-
Summary of RNA Microarray.svg 1,020 × 858; 67 KB
-
Summary of RNA-Seq-ru.svg 1,020 × 803; 246 KB
-
Summary of RNA-Seq.png 3,096 × 2,439; 199 KB
-
Summary of RNA-Seq.svg 1,020 × 803; 246 KB
-
Summary of SAGE-ru.svg 938 × 756; 182 KB
-
Summary of SAGE.png 3,095 × 2,517; 192 KB
-
Summary of SAGE.svg 938 × 756; 180 KB
-
Transcriptomes heatmap example-ru.svg 483 × 638; 333 KB
-
Transcriptomes heatmap example.svg 483 × 638; 502 KB
-
Transcriptomics process summary.svg 283 × 439; 435 KB
-
Transcriptomics technique publications over time-ru.svg 294 × 207; 170 KB
-
Transcriptomics technique publications over time.svg 294 × 212; 133 KB
-
-
-
-


