Category:Renewable energy statistics
Jump to navigation
Jump to search
Subcategories
This category has the following 7 subcategories, out of 7 total.
B
- Bioenergy statistics (19 F)
G
- Geothermal energy statistics (14 F)
H
- Hydropower statistics (23 F)
R
S
W
Media in category "Renewable energy statistics"
The following 179 files are in this category, out of 179 total.
-
10 pays monde consommateurs électricité.svg 938 × 563; 106 KB
-
10 pays UE-27 consommateurs électricité.svg 938 × 563; 111 KB
-
10 YR Electric Energy Generation 2005-2015.jpg 476 × 431; 46 KB
-
1990- Renewable energy production, by source cs.svg 1,000 × 750; 5 KB
-
1990- Renewable energy production, by source.svg 1,000 × 750; 5 KB
-
2007- New solar installations - annually by country or region.svg 1,250 × 675; 6 KB
-
2009- Floating solar photovoltaic energy production - PV - bar chart.svg 1,000 × 750; 2 KB
-
2010- Cost of renewable energy - IRENA.svg 1,000 × 750; 8 KB
-
2010- Decreasing renewable energy costs versus deployment.svg 1,000 × 750; 5 KB
-
2010- Fossil fuels vs Wind + Solar - electricity generation.svg 859 × 750; 8 KB
-
2011- Capacité énergie-renouvelable - International Energy Agency.svg 1,063 × 750; 6 KB
-
2011- Renewable energy capacity - International Energy Agency-cs.svg 1,200 × 675; 4 KB
-
2011- Renewable energy capacity - International Energy Agency.svg 1,200 × 675; 4 KB
-
2011staterenewableelectricalgeneration.png 481 × 661; 8 KB
-
2015- Clean energy vs fossil fuel investment - IEA.svg 1,000 × 750; 3 KB
-
20201019 Levelized Cost of Energy (LCOE, Lazard) - renewable energy.svg 1,200 × 675; 4 KB
-
2021 Death rates, by energy source.svg 1,200 × 675; 3 KB
-
20210119 Renewable energy investment - 2004- BloombergNEF cs.svg 512 × 346; 11 KB
-
20210119 Renewable energy investment - 2004- BloombergNEF-cs.svg 850 × 575; 39 KB
-
20210119 Renewable energy investment - 2004- BloombergNEF.svg 1,200 × 675; 4 KB
-
20230331 1Q2023 Electricity generation in the UK - pie chart.svg 750 × 800; 2 KB
-
3-Learning-curves-for-electricity-prices.png 2,879 × 2,478; 110 KB
-
5-Bar-chart-–-What-is-the-safest-form-of-energy.png 1,350 × 727; 358 KB
-
Aandeel duurzaam.png 1,333 × 1,647; 28 KB
-
Biofuel production by region, OWID.svg 850 × 600; 37 KB
-
Biofuel-production (OWID 0077).png 850 × 600; 62 KB
-
Biofuels-production-by-region (OWID 0079).png 850 × 600; 73 KB
-
Capacite energie renouvelable 1990-2007.svg 498 × 367; 119 KB
-
Charges service public EnR métropole.jpg 529 × 340; 22 KB
-
Charges service public électricité 2003-2013.jpg 518 × 340; 27 KB
-
Chile's Non Conventional Renewable Energy Target.png 539 × 328; 8 KB
-
CO2 Emissions from Electricity Production IPCC.png 1,244 × 773; 42 KB
-
Consumption-co2-emissions-vs-population (OWID 0251).png 850 × 600; 91 KB
-
Cost of electricity by source.png 2,294 × 1,074; 166 KB
-
CSPE unitaire 2002-2013.jpg 537 × 340; 29 KB
-
Cumulative installed marine energy capacity, OWID.svg 850 × 600; 9 KB
-
Cumulative-installed-wind-energy-capacity-gigawatts (OWID 0210).png 850 × 600; 71 KB
-
Death rates from energy production per TWh.png 792 × 518; 38 KB
-
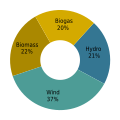
Donut chart spain.png 483 × 291; 10 KB
-
Dunkelflaute Duitsland januari 2017.png 1,512 × 555; 42 KB
-
Electricity percentage worldwide by source-semilog.png 1,024 × 768; 16 KB
-
Electricity percentage worldwide by source.png 800 × 600; 30 KB
-
Energy production in the Netherlands by source.svg 547 × 338; 87 KB
-
Energy Transition Timeline.pdf 2,750 × 1,629; 786 KB
-
Estimated Renewable Share of Total Final Energy Consumption (TFEC) 2009 v. 2019.png 1,181 × 1,181; 186 KB
-
EU-27 share of renewable energy vs 2020 target.png 1,903 × 873; 112 KB
-
Expected structure of renewable energy production in 2020.png 621 × 417; 14 KB
-
Germany 2020-05-28 Live CO₂ emissions of electricity consumption.png 516 × 724; 36 KB
-
Global Energy Consumption tl.svg 960 × 791; 78 KB
-
Global Energy Consumption.svg 960 × 791; 43 KB
-
Global energy potential and consumption.svg 840 × 636; 85 KB
-
Global primary energy consumption by source 1900 - 2021.png 3,400 × 2,400; 525 KB
-
Global primary energy consumption by source.png 1,817 × 845; 104 KB
-
Global public support for energy sources (Ipsos 2011).png 1,030 × 637; 34 KB
-
Global renewable energy consumption, OWID.svg 850 × 600; 16 KB
-
Global Solar Atlas 1.0.png 1,917 × 969; 1.8 MB
-
Global-Offshore-Wind-Potential-WBG-ESMAP.png 8,185 × 5,787; 7.13 MB
-
Global-RE-Investment-VC-Eng.png 596 × 510; 17 KB
-
Global-RE-Investment-VC-JP.png 592 × 516; 19 KB
-
GlobalREPowerCapacity-exHydro-Eng.png 638 × 567; 11 KB
-
GlobalREPowerCapacity-exHydro-JP.png 641 × 565; 12 KB
-
Graph RE Australia 2010.svg 600 × 600; 16 KB
-
Graph RE UK mix.svg 600 × 600; 16 KB
-
Greenhouse gas emissions per energy source.png 1,688 × 1,041; 118 KB
-
Growth of Wind and Solar to 92% by 2030.png 640 × 480; 23 KB
-
GSR 2016 renewable Energy.jpg 3,508 × 2,480; 1.59 MB
-
Haalbaarheid eu doelstellingen.gif 576 × 294; 7 KB
-
Hydro-consumption-by-region (OWID 0506).png 850 × 600; 81 KB
-
Hydro-share-energy-2019.svg 850 × 600; 166 KB
-
Hydropower-consumption (OWID 0502).png 850 × 600; 101 KB
-
Installed renewable energy capacity, OWID.svg 850 × 600; 5 KB
-
International finance received for clean energy, OWID.svg 850 × 600; 140 KB
-
Investment in renewable energy, by technology, OWID.svg 850 × 600; 18 KB
-
Italy 2015.png 481 × 289; 9 KB
-
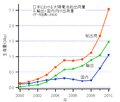
Japan-SolarCellProductionAndExport.png 624 × 532; 10 KB
-
Kapazität Offshore-Wind 2012-2021.svg 1,280 × 720; 9 KB
-
Kapazität OffshoreWindkraftwerke 2010 bis 2022 Balken.png 3,216 × 2,461; 84 KB
-
Kapazität OffshoreWindkraftwerke 2010 bis 2023 Balken.png 3,216 × 2,462; 86 KB
-
Landverbrauch erneuerbare Energien.jpg 1,764 × 2,213; 539 KB
-
Megujuloenergia vilagon 2005.jpg 771 × 630; 187 KB
-
Modern renewable energy generation by source, World.png 3,400 × 2,765; 625 KB
-
Modern-renewable-energy-consumption (OWID 0655).png 850 × 600; 59 KB
-
Modern-renewable-prod (OWID 0652).png 850 × 600; 57 KB
-
Modern-renewable-prod.svg 850 × 600; 48 KB
-
ModulePrices-Japan-2010.png 553 × 486; 7 KB
-
Number of patents filed for renewable energy technologies, OWID.svg 850 × 600; 26 KB
-
Pay-As-You-Save Model .png 746 × 508; 67 KB
-
Per-capita-electricity-fossil-nuclear-renewables (OWID 0773).png 850 × 600; 65 KB
-
Per-capita-electricity-source-stacked (OWID 0772).png 850 × 600; 81 KB
-
Percentage electricity generation in Denmark by source.png 542 × 333; 13 KB
-
Price-of-electricity-new-renewables-vs-new-fossil-no-geo.png 2,426 × 3,747; 362 KB
-
Prod élec renouv Chine hors hydro.jpg 529 × 378; 22 KB
-
Prod élec renouv Danemark.jpg 378 × 265; 18 KB
-
Prod éol+nucl FC.jpg 442 × 284; 29 KB
-
Production allemande totale EnR.jpg 442 × 302; 28 KB
-
Production électricité dans le monde.svg 970 × 528; 74 KB
-
Production électricité énergies renouvelables dans le monde.svg 901 × 528; 101 KB
-
Production énergies renouvelables France 1970-2011.jpg 567 × 340; 28 KB
-
PV-Produktion weltweit 2005 - 2020.svg 515 × 278; 296 KB
-
Re investment 1995-2007.jpg 657 × 383; 87 KB
-
Re investment 2007-2017.jpg 773 × 403; 115 KB
-
RE mix Italy.png 706 × 464; 45 KB
-
RE-CapChangeShare-Eng.png 563 × 446; 27 KB
-
RE-CapChangeShare-JP.png 564 × 446; 24 KB
-
RE-Cost-ETP-2010-JP.PNG 528 × 444; 18 KB
-
RE-Cost-ETP-2050-JP.png 530 × 440; 18 KB
-
RE-OMCost-ETP-2010-JP.png 532 × 439; 20 KB
-
RE-OMCost-ETP-2050-JP.png 530 × 441; 21 KB
-
RE-share-2008-Eng.PNG 596 × 490; 23 KB
-
RE-share-2008-JP.PNG 594 × 507; 20 KB
-
RE-share-2008-Num.PNG 564 × 306; 17 KB
-
Ren2006-es.png 800 × 600; 36 KB
-
Ren2006.png 800 × 600; 26 KB
-
Ren2008.png 800 × 600; 32 KB
-
Ren2008.svg 800 × 600; 379 KB
-
Renewable capacity 2011.png 1,024 × 768; 41 KB
-
Renewable Energy Atlas of Australia - Highest Wave Power.png 856 × 588; 84 KB
-
Renewable Energy Atlas of Australia Mean Wind Speed 80m above ground level.jpg 1,410 × 976; 142 KB
-
Renewable energy by source irena-no.svg 576 × 432; 39 KB
-
Renewable energy consumption vs. GDP per capita, OWID.svg 850 × 600; 44 KB
-
Renewable energy generation, 1, OWID.svg 850 × 600; 16 KB
-
Renewable energy generation, OWID.svg 850 × 600; 13 KB
-
Renewable energy generation, World.jpg 848 × 589; 39 KB
-
Renewable Energy Investment (% of GDP), OWID.svg 850 × 600; 7 KB
-
Renewable Energy Investment, OWID.svg 850 × 600; 14 KB
-
Renewable energy share India 2013.png 772 × 459; 24 KB
-
Renewable Energy Shares and Targets G20 Countries 2019 and 2020.png 1,181 × 1,181; 179 KB
-
Renewable-energy-consumption (OWID 0864).png 850 × 600; 62 KB
-
Renewable-energy-consumption-1965-2016.svg 850 × 600; 33 KB
-
Renewable-energy-gen (OWID 0863).png 850 × 600; 58 KB
-
Renewable-energy-investment.png 3,400 × 2,400; 660 KB
-
Renewables-timeline.png 540 × 382; 14 KB
-
RES4MED-Context.jpg 1,489 × 738; 341 KB
-
RES4MED-Context2.png 888 × 396; 28 KB
-
Serie storiche di energia da rifiuti urbani.png 491 × 467; 51 KB
-
Serie storiche di energia eolica.png 486 × 470; 61 KB
-
Serie storiche di energia solare.png 571 × 471; 53 KB
-
Share of electricity production from renewable sources, OWID.svg 850 × 600; 141 KB
-
Share of electricity production from renewables (2020).jpg 847 × 574; 53 KB
-
Share of electricity production from renewables.svg 850 × 600; 165 KB
-
Share of electricity production from solar and wind, 1985-2022, Our World in Data.jpg 3,400 × 2,400; 396 KB
-
Share of final energy consumption from renewable sources, OWID.svg 850 × 600; 141 KB
-
Share-electricity-low-carbon (OWID 0922).png 850 × 600; 117 KB
-
Solar-pv-energy-consumption-vs-solar-pv-capacity (OWID 1085).png 850 × 600; 71 KB
-
Stati per produzione di energia da rifiuti urbani.png 772 × 468; 96 KB
-
Stati per produzione di energia eolica.png 763 × 471; 112 KB
-
Stati per produzione di energia solare.png 780 × 469; 83 KB
-
Tendances des coûts de l'énergie (2010-2019).png 2,879 × 2,268; 356 KB
-
Top 10 clean energy financing institutions 2014.png 4,168 × 3,201; 303 KB
-
Total World Energy Consumption by Source 2009.png 1,036 × 356; 38 KB
-
Total World Energy Consumption by Source 2010.png 1,268 × 600; 52 KB
-
Total World Energy Consumption by Source 2011.png 1,960 × 840; 79 KB
-
Total World Energy Consumption by Source 2013.png 1,870 × 930; 64 KB
-
US wind power LCOE vs wind speed in 2012.png 842 × 505; 51 KB
-
Wachstum-Erneuerbare-Weltweit-2013.jpg 1,447 × 928; 202 KB
-
What-is-the-safest-form-of-energy.png 2,619 × 1,444; 243 KB
-
World DNI Solar-resource-map GlobalSolarAtlas World-Bank-Esmap-Solargis.png 1,889 × 1,122; 1.49 MB
-
World energy consumption 2005-2035 EIA.png 640 × 480; 26 KB
-
World renewable energy 2005a.png 882 × 705; 18 KB
-
WORLD RENEWABLE ENERGY DISTRIBUTION.png 640 × 303; 104 KB
-
World Wind and Solar Generation Percentage-semilog.svg 800 × 600; 13 KB
-
World-solar-wind-installed-capacity.jpg 1,611 × 1,028; 215 KB
-
Yearly Installed PV Capacity in GW from 2002 to 2015.png 411 × 299; 18 KB
-
Yearly Installed PV Capacity in GW from 2002 to 2015.svg 992 × 744; 52 KB
-
Österreich-Energiezusammensetzung.svg 450 × 350; 7 KB


