Category:Bioenergy statistics
Jump to navigation
Jump to search
Media in category "Bioenergy statistics"
The following 19 files are in this category, out of 19 total.
-
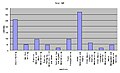
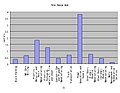 BioEnergy.JPG 577 × 447; 34 KB
-
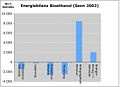 Bioethanol Energiebilanz.jpg 685 × 495; 42 KB
-
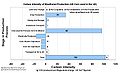 BioEthanolFootprint.jpg 959 × 587; 153 KB
-
 BioethanolsCountryOfOrigin.jpg 1,357 × 949; 161 KB
-
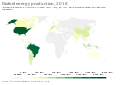 Biofuel energy production, OWID.svg 850 × 600; 141 KB
-
 Biofuel-energy-production.svg 850 × 600; 168 KB
-
 Biofuels in eu 2007.png 649 × 419; 14 KB
-
 BioGWP.JPG 580 × 355; 28 KB
-
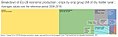 Biomasse cultivée 2018 UE 28 CCR EN.jpg 1,401 × 436; 147 KB
-
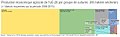 Biomasse cultivée 2018 UE 28 CCR FR.jpg 1,422 × 434; 143 KB
-
 BioSLCA.JPG 768 × 410; 25 KB
-
 Brazil Ethanol Price Ranking by State Oct2008 with titles.png 614 × 753; 234 KB
-
 Crops by crop group (bottom pane) 2018 UE 28 CCR.jpg 1,427 × 632; 291 KB
-
 Historical trend alcohol production by ethanol type Brazil 1990 2008.png 886 × 717; 107 KB
-
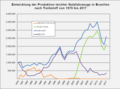 Historical trend ethanol and flex veh in Brazil 1979 2008 de.png 821 × 606; 76 KB
-
 Historical trend ethanol and flex veh in Brazil 1979 2008.png 821 × 606; 73 KB
-
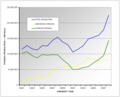
 Historical trend ethanol production by region Brazil 1990 2008.png 1,181 × 821; 170 KB
-
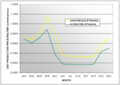 Monthly variation of ethanol producer prices 2007 Brazil.png 886 × 627; 118 KB
-
 Vapor ethanol mixtures Fig 4.3.jpg 1,182 × 612; 152 KB


_2018_UE_28_CCR.jpg)


