Category:Maps of weather and climate in the 2000s
Jump to navigation
Jump to search
Subcategories
This category has the following 12 subcategories, out of 12 total.
Media in category "Maps of weather and climate in the 2000s"
The following 37 files are in this category, out of 37 total.
-
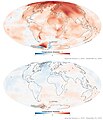
GISS temperature 2000-09 lrg.png 2,880 × 1,440; 545 KB
-
NASA-global-warming-map-1970-79-to-2000-09.jpg 753 × 879; 288 KB
-
Earth Temperature.gif 640 × 480; 5.16 MB
-
Global tropical cyclone tracks.jpg 8,000 × 4,000; 6.55 MB
-
Mediterranean Drought Hoerlingetalfig1b.jpg 1,679 × 1,212; 965 KB
-
NASA temperature trend.png 1,499 × 715; 936 KB
-
Global tropical cyclone tracks-edit.jpg 8,000 × 4,000; 5.92 MB
-
Global tropical cyclone tracks-edit2.jpg 8,000 × 4,000; 5.73 MB
-
NASA sea level change trend.jpg 662 × 504; 59 KB
-
NOAA sea level trend 1993 2010.png 2,425 × 1,337; 1.5 MB
-
Seasonal westafrica rainfall mean 20070501 20070930.gif 800 × 600; 25 KB
-
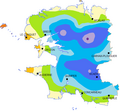
Précipitation dept29.png 623 × 575; 29 KB
-
Climate-change-template.jpg 80 × 40; 1 KB
-
Global Warming Map.jpg 800 × 596; 212 KB
-
Global Warming Map-he.jpg 800 × 596; 80 KB
-
Graaddagen-2010.jpg 712 × 493; 85 KB
-
AIRS MaunaLoa CO2 Jul2008.jpg 769 × 433; 42 KB
-
Ice Sheet Mass Balance from GRACE.ogv 21 s, 1,920 × 1,080; 21.6 MB
-
AIRS OLR.png 1,813 × 1,010; 5.46 MB
-
Carbonivores.ogv 25 s, 960 × 540; 4.68 MB
-
Gocart sulfate optical thickness.png 2,113 × 1,176; 5.11 MB
-
Iraqndvia spt 200804 lrg.jpg 700 × 525; 258 KB
-
Modis aerosol optical depth.png 2,413 × 1,352; 6.67 MB
-
Africa 4-gs13.png 1,040 × 1,000; 398 KB
-
Antarctica temps2 1957-2006.jpg 3,200 × 2,917; 749 KB
-
AntarcticaTemps 1957-2006.jpg 720 × 480; 267 KB
-
AntarcticaTemps3 1957-2006.png 863 × 656; 821 KB
-
PVGIS Africa SolarPotential img v2.png 1,719 × 1,344; 1.73 MB
-
PVGIS Africa SolarPotential.bigopti.png 3,399 × 3,677; 9.02 MB
-
Seasonal westafrica rainfall mean 20070501 20070930 Ar.gif 800 × 629; 68 KB
-
SolarGIS-Solar-map-Africa-and-Middle-East-ar.png 850 × 850; 661 KB
-
SolarGIS-Solar-map-Africa-and-Middle-East-de.png 850 × 850; 663 KB
-
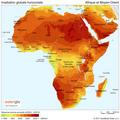
SolarGIS-Solar-map-Africa-and-Middle-East-en.png 850 × 850; 561 KB
-
SolarGIS-Solar-map-Africa-and-Middle-East-fr.png 850 × 850; 664 KB
-
SolarGIS-Solar-map-Africa-and-Middle-East-it.png 850 × 850; 666 KB
-
Summer temperatures Northern Hemisphere 1955 to 2011.ogv 31 s, 960 × 540; 2.45 MB
-
Trend June max temp 1950 2009.svg 740 × 449; 1.76 MB


