Category:Life expectancy charts for the United States
Jump to navigation
Jump to search
Media in category "Life expectancy charts for the United States"
The following 66 files are in this category, out of 66 total.
-
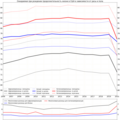
20200101 Life expectancy increases with age already achieved - chart.svg 1,000 × 750; 9 KB
-
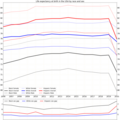
20200101 Remaining life expectancy - US.svg 1,000 × 750; 9 KB
-
Comparison of life expectancy in USA China Russia -ru.png 1,162 × 714; 84 KB
-
Comparison of life expectancy in USA China Russia.png 1,162 × 714; 81 KB
-
Difference in female and male life expectancy at birth, OWID.svg 850 × 600; 16 KB
-
Esperanza de vida de Cuba.png 1,139 × 583; 36 KB
-
Esperanza de vida de la URSS.png 709 × 465; 21 KB
-
Female-to-male life expectancy ratio, OWID.svg 850 × 600; 23 KB
-
Gapminder Life Expectancy in high income countries.png 1,280 × 800; 163 KB
-
HC-Graph.jpg 2,552 × 3,348; 375 KB
-
Health systems comparison OECD 2008.png 791 × 1,094; 671 KB
-
Healthy life expectancy bar chart -America -ru.png 1,333 × 592; 89 KB
-
Healthy life expectancy bar chart -America -sex -ru.png 1,333 × 592; 73 KB
-
Healthy life expectancy bar chart -America -sex.png 1,333 × 576; 62 KB
-
Healthy life expectancy bar chart -America.png 1,333 × 576; 79 KB
-
Healthy life expectancy bar chart -world -ru.png 1,724 × 584; 106 KB
-
Healthy life expectancy bar chart -world -sex -ru.png 1,724 × 584; 81 KB
-
Healthy life expectancy bar chart -world -sex.png 1,724 × 587; 71 KB
-
Healthy life expectancy bar chart -world.png 1,724 × 587; 98 KB
-
Household Income Percentile.png 944 × 910; 443 KB
-
Life expectancy 1900-2015.jpg 660 × 948; 149 KB
-
Life expectancy at age 15 by sex, OWID.svg 850 × 600; 16 KB
-
Life Expectancy at birth (OECD data), OWID.svg 850 × 600; 28 KB
-
Life expectancy at birth by sex in US, 2000 to 2021.png 874 × 550; 61 KB
-
Life Expectancy at Birth for Males and Females - USA - 1950-2050.png 1,050 × 582; 29 KB
-
Life expectancy by age in 1900, 1950, and 1997 United States.Jpg 1,468 × 687; 80 KB
-
Life expectancy by WBG -USA -diff -ru.png 1,153 × 721; 90 KB
-
Life expectancy by WBG -USA -diff.png 1,153 × 721; 85 KB
-
Life expectancy by WBG -USA -leader -ru.png 1,297 × 829; 114 KB
-
Life expectancy by WBG -USA -leader.png 1,297 × 829; 110 KB
-
Life expectancy by WBG -USA -ru.png 1,162 × 607; 75 KB
-
Life expectancy by WBG -USA.png 1,162 × 607; 71 KB
-
Life expectancy in countries of North America -ru.png 1,386 × 880; 149 KB
-
Life expectancy in countries of North America.png 1,386 × 880; 145 KB
-
Life expectancy in Russia and the US -ru.png 1,162 × 497; 62 KB
-
Life expectancy in Russia and the US.png 1,162 × 497; 61 KB
-
Life expectancy in selected countries and regions since 1950.svg 630 × 630; 44 KB
-
Life expectancy in some big countries -ru.png 1,386 × 880; 208 KB
-
Life expectancy in some big countries.png 1,386 × 880; 200 KB
-
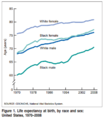
Life Expectancy in the U.S. by race 1900-2019.png 1,200 × 1,200; 97 KB
-
Life expectancy in the United States.svg 850 × 600; 37 KB
-
Life expectancy in USA and Canada.jpg 794 × 505; 33 KB
-
Life expectancy in USA and Canada.svg 850 × 600; 47 KB
-
Life expectancy in USA by race -all data -ru.png 950 × 726; 114 KB
-
Life expectancy in USA by race -all data.png 894 × 699; 95 KB
-
Life expectancy in USA by race -male and female -ru.png 950 × 726; 88 KB
-
Life expectancy in USA by race -male and female.png 894 × 699; 75 KB
-
Life expectancy in USA by race -only overall -ru.png 950 × 726; 61 KB
-
Life expectancy in USA by race -only overall.png 894 × 699; 46 KB
-
Life expectancy in USA by race -sex gap -ru.png 1,153 × 1,153; 155 KB
-
Life expectancy in USA by race -sex gap.png 1,081 × 1,081; 131 KB
-
Life expectancy is longer in more equal rich countries.jpg 996 × 716; 51 KB
-
Life expectancy of Cuba.png 1,140 × 588; 33 KB
-
Life expectancy post-COVID.png 695 × 628; 224 KB
-
Life Expectancy U.S. Trends (Alt).png 358 × 400; 38 KB
-
Life expectancy US.webp 1,439 × 418; 15 KB
-
Life expectancy USSR.png 739 × 464; 22 KB
-
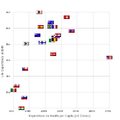
Life expectancy vs healthcare spending.jpg 1,876 × 1,816; 553 KB
-
Life expectancy vs spending OECD.png 500 × 500; 9 KB
-
Life expectancy vs. health expenditure, OWID.svg 850 × 600; 40 KB
-
Life-expectancy-us-1900-2011.png 548 × 328; 25 KB
-
Percentage of US Population Over Age 65 1950-2050.png 744 × 503; 18 KB
-
Percentage Surviving to Certain Ages in the U.S..png 1,425 × 913; 237 KB


