Category:Demographic charts of the United States
Jump to navigation
Jump to search
Subcategories
This category has the following 5 subcategories, out of 5 total.
Media in category "Demographic charts of the United States"
The following 86 files are in this category, out of 86 total.
-
1923GraphOfDiminishingAmericanFarmPopulation.png 2,842 × 1,710; 169 KB
-
2009 Drivers and Vehicles in US.png 936 × 712; 28 KB
-
Admixturehispanicswest.jpg 324 × 960; 39 KB
-
Age differences for spouses (USA).png 724 × 471; 13 KB
-
Age Distribution of Holland MI.png 911 × 623; 64 KB
-
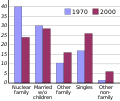
American Household Composition Past and Present.png 675 × 340; 18 KB
-
Arrivees americains par etat 2000-2007.svg 652 × 551; 118 KB
-
Atlas of Bucks Co., Penna. LOC 2012587544-5.jpg 4,074 × 5,530; 2.3 MB
-
Birth Rate in USA 1934-2004.PNG 800 × 432; 60 KB
-
Birth rate, death rate and natural growth in USA since 1935.jpg 672 × 455; 50 KB
-
BirthDeath 1950 US.svg 480 × 320; 8 KB
-
Demography Brule County.svg 1,240 × 660; 5 KB
-
Castillero.png 800 × 600; 9 KB
-
Census-2000-Data-Top-US-Ancestries es.svg 1,780 × 1,976; 491 KB
-
Census-2000-Data-Top-US-Ancestries.jpg 1,752 × 1,976; 277 KB
-
Class distribution US.svg 466 × 391; 13 KB
-
Cleveland Population, 1940-2020.png 1,148 × 688; 73 KB
-
Composition raciale de la population - Vacaville (Californie).jpg 970 × 603; 43 KB
-
Einwohnerentwicklung Tacoma 1883bis2006.png 893 × 615; 90 KB
-
Ethic California Organized Pie.png 878 × 704; 62 KB
-
Ethnic groups of Muslim Americans.png 337 × 170; 10 KB
-
Demography Fall River County.svg 1,240 × 660; 6 KB
-
Families US Historical.png 518 × 312; 16 KB
-
Families US.png 339 × 343; 10 KB
-
Families US.svg 630 × 530; 19 KB
-
Fig 109 - does someone in house belong to union.JPG 525 × 420; 40 KB
-
Foreign Born in U.S. Number and Share 1900-2019.png 1,383 × 787; 59 KB
-
Foreign-Born United States 1850 to 2060.jpg 1,854 × 1,430; 617 KB
-
FranklinCountyIowaPop2020.png 1,240 × 657; 39 KB
-
Grafica2018.png 745 × 355; 11 KB
-
Grafica2019.png 818 × 475; 16 KB
-
Graficaespeeuu.jpg 635 × 372; 48 KB
-
Graph evol pop etat USA 1980-2007.svg 677 × 470; 121 KB
-
Demography Hamlin County.svg 1,240 × 660; 5 KB
-
Homeownership rates by race & ethnicity.png 1,097 × 679; 164 KB
-
Homeownership rates by race.png 1,063 × 654; 160 KB
-
Household types in the us 2006.png 875 × 567; 49 KB
-
Immigration par etat 2000-2007.svg 599 × 473; 120 KB
-
JapanesePopulationHawaii1890&1920.jpg 559 × 337; 32 KB
-
Demography Jones County.svg 1,240 × 660; 5 KB
-
Demography Kingsbury County.svg 1,240 × 660; 6 KB
-
Life Expectancy at Birth for Males and Females - USA - 1950-2050.png 1,050 × 582; 29 KB
-
New haven race-ethnicity-color-nativity-origin 1790-2010.png 2,550 × 2,100; 327 KB
-
Ohio cities by population (2010 Census).png 650 × 253; 54 KB
-
Pie chart of US population by state.png 877 × 700; 49 KB
-
Population of the United States.webp 1,631 × 588; 28 KB
-
Poverty Rates by Sex and Work Status for Americans 65+ in 2006.png 692 × 502; 29 KB
-
Projected Hispanic Population in the United States 2020 to 2060.jpg 648 × 483; 62 KB
-
Projected US Population by Immigration Scenario 2016 to 2060.jpg 1,162 × 1,904; 1.06 MB
-
Projecting Majority-Minority in the United States.jpg 1,329 × 1,093; 442 KB
-
Projection of the Demographics in USA.jpg 732 × 474; 56 KB
-
PSM V69 D167 Statistics of immigrants held in us penal institutions 1906.png 837 × 1,600; 253 KB
-
PSM V70 D575 Population increase of the usa compared to major european states.png 1,660 × 2,327; 186 KB
-
PSM V86 D180 Urban rural percentage of US population in 1910.jpg 1,234 × 968; 116 KB
-
R-US state areas-density.svg 360 × 225; 70 KB
-
Race and ethnicity in the United States Census, 2010 - ru.svg 1,100 × 454; 47 KB
-
Racial Ethnic Composition Children United States 2016 2060 Projections.jpg 1,373 × 1,435; 400 KB
-
Racial Ethnic Composition of the United States 1970 2050 (cropped).png 2,100 × 1,389; 103 KB
-
Racial Ethnic Composition of the United States 1970 2050.jpg 2,048 × 1,413; 663 KB
-
Religions of the United States pie chart.svg 800 × 600; 33 KB
-
Religions of the United States.png 387 × 190; 12 KB
-
RNI 1950 US.svg 480 × 304; 7 KB
-
Types of us households 2002.png 660 × 497; 39 KB
-
U.S. Population 1900–2016, Population Projections 2017–2060 by Immigration Scenario.jpg 1,991 × 1,359; 535 KB
-
United States cities over 500,000 population.jpg 779 × 804; 105 KB
-
United States family homicides by relationship 1980 2008.svg 503 × 413; 90 KB
-
United States homicide offending rates by race 1980 2008.svg 503 × 413; 64 KB
-
United States homicide victimization rates by race 1980 2008.svg 503 × 413; 64 KB
-
US Occupations.png 528 × 281; 11 KB
-
US Population.GIF 811 × 656; 18 KB
-
US Unemployment 1890-2009.gif 796 × 416; 24 KB
-
US vs Latin America Growth Rates.jpg 917 × 663; 82 KB
-
USA live births, deaths and natural increase since 1935.jpg 922 × 613; 71 KB
-
Usa-poblacion.jpg 601 × 286; 24 KB
-
Usbirths.gif 466 × 307; 8 KB
-
VisaBacklog.jpg 677 × 461; 56 KB
-
Voter Turnout by Sex and Age, 2008 US Presidential Election.png 911 × 588; 35 KB
-
WAIS-IV FSIQ Scores by Race and Ethnicity.png 1,000 × 600; 87 KB


