Category:Global air pollution statistics
Jump to navigation
Jump to search
Subcategories
This category has the following 3 subcategories, out of 3 total.
Media in category "Global air pollution statistics"
The following 83 files are in this category, out of 83 total.
-
Access to clean fuels and technologies for cooking, OWID.svg 850 × 600; 141 KB
-
AGAGE sulfur hexafluroride growth.png 600 × 446; 31 KB
-
Annual change in atmospheric CFC-11 concentrations, OWID.svg 850 × 600; 6 KB
-
BK HFC32.jpg 809 × 374; 50 KB
-
BK MC.jpg 820 × 374; 44 KB
-
Carbon tetrafluoride concentration.jpg 813 × 376; 49 KB
-
CCl4 mm.png 3,503 × 1,977; 514 KB
-
CFC-11 mm.png 3,503 × 1,977; 454 KB
-
CFC-113 mm.png 3,503 × 1,977; 398 KB
-
CH2Cl2 mm.png 3,503 × 1,977; 631 KB
-
CH3Br mm.png 3,503 × 1,977; 634 KB
-
CH3CCl3 mm.png 3,503 × 1,977; 434 KB
-
CH3Cl mm.png 3,503 × 1,977; 782 KB
-
CH4 mm.png 3,503 × 1,977; 554 KB
-
Consumption of ozone-depleting substances (1986 = 100), OWID.svg 850 × 600; 6 KB
-
CO₂ emissions by sector, World.svg 850 × 600; 52 KB
-
Death rate from indoor air pollution vs. GDP per capita, OWID.svg 850 × 600; 34 KB
-
Death rate from particulate pollution vs GDP per capita, OWID.svg 850 × 600; 36 KB
-
Death rates from air pollution, 1, OWID.svg 850 × 600; 11 KB
-
Death rates from air pollution, OWID.svg 850 × 600; 8 KB
-
Death rates from outdoor air pollution in 1990 vs. 2017, OWID.svg 850 × 600; 38 KB
-
Deaths from household and outdoor air pollution, OWID.svg 850 × 600; 6 KB
-
Deaths from indoor air pollution, by age, OWID.svg 850 × 600; 18 KB
-
Deaths from outdoor air pollution by region, OWID.svg 850 × 600; 17 KB
-
Deaths from outdoor air pollution, by age, OWID.svg 850 × 600; 11 KB
-
Global Carbon Emissions.png 310 × 233; 14 KB
-
Global climate forcing of the industrial era.png 867 × 639; 73 KB
-
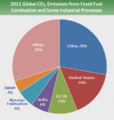
Global emissions country 2014.png 448 × 464; 67 KB
-
Global emissions country 2015.png 448 × 471; 168 KB
-
Global-co2-emissions-fossil-land (OWID 0465).png 850 × 600; 54 KB
-
Global-co2-fossil-plus-land-use (OWID 0468).png 850 × 600; 63 KB
-
Greenhouse gas radiative forcing growth since 1979.svg 992 × 744; 82 KB
-
H-1211 mm.png 3,503 × 1,977; 446 KB
-
H-1301 mm.png 3,503 × 1,977; 509 KB
-
Halogenated gas concentrations 1978-present.png 928 × 598; 24 KB
-
Hats ccl4 global.png 695 × 406; 57 KB
-
Hats f11 global.png 695 × 405; 42 KB
-
Hats f113 global.png 695 × 405; 37 KB
-
Hats f12 global.png 695 × 405; 40 KB
-
HATS Nitrous Oxide concentration.png 695 × 406; 57 KB
-
HATS Nitrous Oxide growth rate.png 695 × 385; 43 KB
-
HCFC and HFC atmospheric trends.png 1,094 × 1,138; 245 KB
-
HCFC-22 mm.png 3,503 × 1,977; 428 KB
-
HCFC141b concentration.jpg 809 × 374; 52 KB
-
HCFC142b concentration.jpg 809 × 374; 51 KB
-
HCFC22 concentration.jpg 818 × 374; 53 KB
-
Hexafluoroethane concentration.jpg 818 × 374; 57 KB
-
HFC-125 mm.png 3,503 × 1,977; 379 KB
-
HFC-134a mm.png 3,503 × 1,977; 421 KB
-
HFC-23 mm.png 3,503 × 1,977; 424 KB
-
HFC-32 mm.png 3,503 × 1,977; 369 KB
-
HFC125 concentration.jpg 809 × 374; 49 KB
-
HFC143a concentration.jpg 809 × 374; 51 KB
-
HFC152a concentration.jpg 809 × 374; 69 KB
-
Household air pollution deaths by region, OWID.svg 850 × 600; 23 KB
-
How-many-people-die-from-air-pollution-1-1.png 2,648 × 1,551; 271 KB
-
Mauna Loa HFC-134a (CH2FCF3) concentration.png 1,200 × 900; 112 KB
-
Mauna Loa Tetrafluoromethane.jpg 1,051 × 791; 259 KB
-
Mlo ch4 ts obs 03437.png 1,200 × 900; 136 KB
-
Monthly means of CFC-12.png 3,503 × 1,977; 402 KB
-
N2O mm.png 3,503 × 1,977; 463 KB
-
Nitrogen Trifluoride concentration.jpg 820 × 374; 50 KB
-
Number of deaths from air pollution, OWID.svg 850 × 600; 8 KB
-
Number of deaths from indoor air pollution, 1990 vs. 2017, OWID.svg 850 × 600; 38 KB
-
Outdoor air pollution death rate vs. GDP per capita, OWID.svg 850 × 600; 36 KB
-
Outdoor air pollution death rates by age, OWID.svg 850 × 600; 6 KB
-
Outdoor air pollution deaths by age, OWID.svg 850 × 600; 21 KB
-
Outdoor air pollution deaths in 1990 vs. 2017, OWID.svg 850 × 600; 36 KB
-
Per-capita-co2-fuel (OWID 0786).png 850 × 600; 42 KB
-
Prod-cons-co2-per-capita (OWID 0902).png 850 × 600; 51 KB
-
SF6 mm.png 3,503 × 1,977; 390 KB
-
So-emissions-by-world-region-in-million-tonnes (OWID 0972).png 850 × 600; 78 KB
-
SO2F2 mm.png 3,503 × 1,977; 474 KB
-
Sulfur Hexafluoride concentration.png 695 × 406; 51 KB
-
Sulfuryl fluoride concentration.jpg 822 × 376; 54 KB
-
Tetrafluoromethane concentration.jpg 811 × 374; 49 KB


