Category:Glaciological diagrams
Jump to navigation
Jump to search
Subcategories
This category has the following 16 subcategories, out of 16 total.
+
- Glacier drawings (3 F)
A
G
- Glacial morphology diagrams (28 F)
I
- Ice phase diagrams (17 F)
- Diagrams of ice shelves (11 F)
K
- Katabatic wind diagrams (19 F)
P
- Permafrost diagrams (29 F)
R
- Rock glacier diagrams (2 F)
S
- Diagrams of sea ice (24 F)
Media in category "Glaciological diagrams"
The following 129 files are in this category, out of 129 total.
-
2019 MPAS sea ice grid.tif 1,153 × 984; 4.33 MB
-
202006 KaufmanEtAl Holocene Temp NH Bond.png 840 × 1,283; 415 KB
-
20201210 Antarctica ice mass variation - NASA GRACE-en.svg 1,000 × 750; 5 KB
-
20210125 The Cryosphere - Floating and grounded ice - imbalance - climate change.png 1,889 × 1,288; 61 KB
-
Alps-glaciers.png 479 × 404; 20 KB
-
Atmospheric CO2 with glaciers cycles.png 939 × 680; 41 KB
-
Benthic delta o18 3500 0 ka bp 1.svg 1,415 × 609; 59 KB
-
Benthic delta o18 3500 0 ka bp 2.svg 1,415 × 609; 49 KB
-
Benthic delta o18 5500 0 ka bp 1.svg 1,442 × 609; 49 KB
-
Benthic delta o18 5500 0 ka bp 2.svg 1,415 × 609; 46 KB
-
Benthic do18 53-00 ma 1.svg 1,440 × 720; 76 KB
-
Besucherzahlen Demänovaer Eishöhle.PNG 1,419 × 859; 57 KB
-
Bolling allegrod ngrip oxygen isotope image 1.svg 1,620 × 630; 248 KB
-
BondEvents-stacked-bond2001-labeled-de.svg 1,000 × 600; 43 KB
-
BondEvents-stacked-bond2001-labeled-en.svg 1,000 × 600; 43 KB
-
Brine salinity.gif 1,350 × 975; 10 KB
-
Brine volume.gif 1,350 × 975; 14 KB
-
Buzul buzu oluşumu.PNG 238 × 265; 13 KB
-
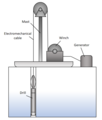
Cable suspended ice core drilling system schematic.png 665 × 785; 42 KB
-
Change in Antarctic ice shelf barrier position and thickness over time.png 2,067 × 1,069; 267 KB
-
Core dogs schematic.png 922 × 804; 71 KB
-
CRREL 1968 electrodrill.png 363 × 1,585; 293 KB
-
Cryobot design.png 1,258 × 853; 397 KB
-
Denekamp.png 522 × 780; 25 KB
-
Eick svsd.png 1,350 × 975; 36 KB
-
Eisdeckenaufbau.svg 565 × 335; 336 KB
-
Epica-vostok-grip-40kyr.png 761 × 245; 9 KB
-
EstriasGlaciaisWitmarsum 1.jpg 1,503 × 1,127; 235 KB
-
ETH-BIB-Meerwasser (Salzgehalt, Dichte, Gefrierpunkt)-Dia 247-Z-00407.tif 3,509 × 2,877; 28.98 MB
-
False bottom coverage at the surface plot of sea ice draft.png 3,600 × 1,500; 1.28 MB
-
False bottom salinity.png 1,860 × 1,320; 123 KB
-
False bottom sonar.png 3,600 × 1,500; 1.29 MB
-
False bottom temperature.png 1,860 × 1,320; 120 KB
-
February Arctic Ice Age Composition.jpg 3,155 × 2,446; 341 KB
-
Formación hielo glaciar Lmb.png 238 × 265; 13 KB
-
Formiranje leda lednika.jpg 238 × 265; 56 KB
-
Franz Jozef Glacier NZ fig13.gif 600 × 362; 28 KB
-
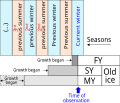
FYvsSYvsMY.svg 538 × 458; 34 KB
-
Gisp2 electrical conductivity 1.jpg 1,100 × 421; 52 KB
-
Glacial ice formation (eu).PNG 238 × 265; 13 KB
-
Glacial ice formation LMB (no text).png 238 × 265; 11 KB
-
Glacial ice formation LMB (sv).jpg 238 × 265; 11 KB
-
Glacial ice formation LMB.png 238 × 265; 12 KB
-
Glacial Tarn Formation SK.jpg 960 × 512; 58 KB
-
GlaciationsinEarthExistancelicenced annotated (bn).png 3,330 × 266; 65 KB
-
GlaciationsinEarthExistancelicenced annotated.jpg 3,316 × 256; 121 KB
-
GlaciationsinEarthExistancelicenced.jpg 829 × 64; 25 KB
-
Glacier quake abundance Greenland 1993-2013 columns.svg 1,362 × 350; 109 KB
-
Greenland stadial 2.jpg 792 × 572; 152 KB
-
Greenland+Antarctica Mass Loss.png 962 × 1,292; 107 KB
-
Grip-ngrip-closeup.png 769 × 467; 10 KB
-
Heinrich-events.png 1,250 × 875; 170 KB
-
Hengelo.png 607 × 746; 28 KB
-
Hmotnosti bilance ledovcu.svg 823 × 625; 93 KB
-
Holocene-Pleniglacial.png 3,648 × 2,736; 115 KB
-
Hot water drill schematic.png 1,369 × 908; 65 KB
-
Huneborg.PNG 520 × 746; 27 KB
-
Ice age water cycle.jpg 823 × 461; 41 KB
-
Ice Chart.png 682 × 494; 56 KB
-
Ice drill cutter geometric parameters.png 1,217 × 744; 77 KB
-
Ice drilling anti-torque devices.png 1,567 × 582; 75 KB
-
Ice flow controls.jpg 229 × 600; 42 KB
-
Ice sheets in the global carbon cycle.png 1,043 × 673; 262 KB
-
Icestream onset-thermal-transition.png 3,197 × 2,040; 382 KB
-
Icestream onset-thermal-transition.svg 1,052 × 744; 40 KB
-
IMB heating.png 1,992 × 1,434; 425 KB
-
Insolation at 65N late glacial holocene 1.svg 1,065 × 532; 46 KB
-
Laptev nsidc 2021175.png 720 × 292; 106 KB
-
Lascaux ngrop deltao18 1.svg 2,062 × 996; 55 KB
-
Lascaux-Interstadial.png 606 × 780; 30 KB
-
Late glacial ngrip delta018 2.svg 2,062 × 996; 61 KB
-
Late glacial temperature curve bolling2.png 1,600 × 766; 329 KB
-
Late glacial temperature curve1.jpg 1,600 × 766; 344 KB
-
Late late glacial ngrip delta018 1.svg 2,062 × 996; 83 KB
-
Laugerie-Interstadial.png 606 × 780; 29 KB
-
Lengteprofiel Maas jan 1940 met ijsgang.jpg 1,338 × 657; 186 KB
-
Lgm delta o18 2.svg 2,062 × 996; 52 KB
-
Lgm ngrip delta-o18 accurate 1.svg 1,620 × 630; 252 KB
-
Middle weichselian oxygen isotope curve 1.gif 1,600 × 766; 196 KB
-
NanoplasticsActicAntarctic2022.jpg 1,144 × 886; 244 KB
-
Ngrip bolling allerod ca2plus 1.png 1,200 × 720; 64 KB
-
Ngrip bolling allerod ch4 1.png 924 × 614; 58 KB
-
Ngrip bolling allerod do18 1.png 1,275 × 944; 240 KB
-
Ngrip late glacial ch4 2.svg 2,250 × 1,406; 40 KB
-
Ngrip lateglacial do18 1.png 640 × 480; 10 KB
-
Ngrip yd pb do18 ch4 2.png 1,114 × 604; 120 KB
-
Ngrip20 yd pb 2.png 1,600 × 766; 207 KB
-
NSIDC arctic sea ice extent since 1979.svg 810 × 540; 37 KB
-
Overdeepening process.jpg 480 × 272; 26 KB
-
Pipeline burrial below seabed gouge.svg 674 × 364; 31 KB
-
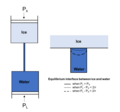
PistonCylinderModelforFrostHeave.png 841 × 785; 39 KB
-
Plot arctic sea ice volume.svg 810 × 540; 43 KB
-
Pretiglian curve lisiecki raymo 2005 1.png 1,600 × 766; 141 KB
-
PSM V05 D416 Liquid planes in ice from pressure.jpg 1,002 × 1,149; 135 KB
-
PSM V05 D421 Mould and ice ball formed by compression.jpg 1,452 × 543; 94 KB
-
Qar xetti.png 714 × 551; 17 KB
-
Quartaer.png 631 × 1,277; 99 KB
-
Reuverian curve zachos 2001 raw data.PNG 1,600 × 766; 179 KB
-
Rt diag.gif 1,350 × 975; 7 KB
-
Salt in ice.jpg 1,000 × 799; 60 KB
-
Sandkegel.svg 1,492 × 244; 699 bytes
-
Sea Ice Changes through time.png 1,000 × 800; 170 KB
-
Sea-ice.area.nh.sh.png 624 × 497; 9 KB
-
SFFEL auger baffle(baffle).jpg 237 × 420; 28 KB
-
SFFEL auger baffle.png 447 × 436; 70 KB
-
SFFEL clearance angle.svg 461 × 261; 38 KB
-
Snow-covered-ice.jpg 1,822 × 840; 754 KB
-
Steam drill schematic.png 848 × 550; 46 KB
-
Strudel plan view on ice Drawing.svg 283 × 196; 24 KB
-
Subglacial submarine discharge.jpg 1,417 × 695; 212 KB
-
Temperature of mangshan loess 1.svg 973 × 488; 37 KB
-
Thermal drill schematics.png 972 × 1,056; 72 KB
-
This diagram shows the relationship between snow and sea ice.jpg 1,200 × 784; 377 KB
-
Vertical Temperature Profile in Permafrost (English Text).jpg 579 × 599; 72 KB
-
Vostok Petit data.svg 1,024 × 768; 81 KB
-
Wurzacher-Ried Riss-Wuerm-Glaziale.jpg 1,200 × 800; 231 KB
-
Yd pb boundary 2.svg 813 × 554; 57 KB
-
Younger Dryas-Preboreal boundary on Ngrip 50 dataset.png 1,527 × 797; 310 KB
-
БСЭ1. Ледники, массы льда 1.jpg 499 × 591; 185 KB
-
БСЭ1. Ледники, массы льда 2.jpg 496 × 376; 134 KB
-
БСЭ1. Ледники, массы льда 3.jpg 466 × 157; 27 KB
-
БСЭ1. Ледники, массы льда 4.jpg 482 × 685; 237 KB
-
БСЭ1. Ледники, массы льда 5.jpg 730 × 502; 246 KB
-
БСЭ1. Ледниковый комплекс.jpg 481 × 115; 28 KB

