Category:Fluorescence resonance energy transfer
Jump to navigation
Jump to search
energy transfer mechanism | |||||
| Upload media | |||||
| Instance of | |||||
|---|---|---|---|---|---|
| Named after |
| ||||
| Said to be the same as | Q12165863 | ||||
| |||||
Media in category "Fluorescence resonance energy transfer"
The following 142 files are in this category, out of 142 total.
-
-
-
-
A-MAPK-Driven-Feedback-Loop-Suppresses-Rac-Activity-to-Promote-RhoA-Driven-Cancer-Cell-Invasion-pcbi.1004909.s011.ogv 2.9 s, 1,024 × 1,024; 1.09 MB
-
-
-
-
-
-
-
-
-
-
-
Bulk vs single-molecule FRET.png 771 × 641; 158 KB
-
BulkFRET VS smFRET.png 1,694 × 2,303; 623 KB
-
-
-
Conditions du FRET (de).png 2,000 × 2,459; 138 KB
-
Conditions du FRET.png 2,000 × 2,459; 76 KB
-
DEAD-Box-Helicase-Proteins-Disrupt-RNA-Tertiary-Structure-Through-Helix-Capture-pbio.1001981.s014.ogv 24 s, 512 × 512; 19.41 MB
-
DFRAP.png 3,008 × 2,069; 1.01 MB
-
Difference singlemolecule ensemble.svg 410 × 210; 72 KB
-
-
-
-
Distinct-predictive-performance-of-Rac1-and-Cdc42-in-cell-migration-srep17527-s2.ogv 8.1 s, 537 × 613; 1.11 MB
-
Distinct-predictive-performance-of-Rac1-and-Cdc42-in-cell-migration-srep17527-s3.ogv 8.1 s, 582 × 582; 1.93 MB
-
-
-
-
FRET biosensor O-GlcNAc .png 1,754 × 1,401; 77 KB
-
FRET biosensor O-GlcNAc Myriad.png 1,754 × 1,401; 77 KB
-
FRET cz CFP YFP.tif 602 × 426; 57 KB
-
FRET cz jablonskeho diagram.tif 528 × 351; 22 KB
-
FRET cz kappa2 orientation factor.tif 1,290 × 1,426; 299 KB
-
FRET cz photobleaching.tif 649 × 462; 278 KB
-
FRET cz proteolyza.tif 338 × 811; 202 KB
-
FRET cz zavislost ucinnosti na ruznych faktorech.tif 636 × 914; 1.67 MB
-
FRET paths.svg 350 × 565; 26 KB
-
FRET probe for the detection of Cd2+.gif 596 × 225; 25 KB
-
FRET schematic.png 2,322 × 2,590; 182 KB
-
FRET-Abstand.png 1,525 × 793; 43 KB
-
FRET-Anwendung.png 800 × 195; 26 KB
-
FRET-Applicazioni.PNG 800 × 195; 25 KB
-
FRET-cGES-DE5.png 602 × 426; 40 KB
-
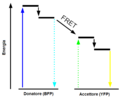
FRET-Energia.PNG 570 × 482; 14 KB
-
FRET-Energie.png 570 × 482; 17 KB
-
FRET-EPAC.png 1,259 × 529; 208 KB
-
FRET-Jablonski-diagram.jpg 1,281 × 646; 75 KB
-
FRET-Jablonski.png 1,231 × 894; 35 KB
-
FRET-Jablonski2 English.png 661 × 440; 25 KB
-
FRET-Jablonski2.png 528 × 351; 12 KB
-
FRET-Orientierung.png 1,403 × 897; 98 KB
-
FRET-Photobleaching.png 649 × 462; 161 KB
-
FRET-Spektren.png 382 × 244; 5 KB
-
FRET-Spektrenüberlappung.png 1,426 × 868; 46 KB
-
FRET-Spettro.PNG 392 × 244; 10 KB
-
Fret.jpg 640 × 439; 20 KB
-
FRET.PNG 365 × 587; 63 KB
-
FRET.png 760 × 1,090; 47 KB
-
Fret.svg 640 × 439; 21 KB
-
-
-
-
-
-
-
-
-
-
-
-
-
-
-
-
-
-
-
Heterogeneous FRET analysis.jpg 1,280 × 720; 44 KB
-
-
-
Human-Mena-Associates-with-Rac1-Small-GTPase-in-Glioblastoma-Cell-Lines-pone.0004765.s008.ogv 5.0 s, 227 × 222; 161 KB
-
Human-Mena-Associates-with-Rac1-Small-GTPase-in-Glioblastoma-Cell-Lines-pone.0004765.s009.ogv 5.0 s, 262 × 222; 212 KB
-
Human-Mena-Associates-with-Rac1-Small-GTPase-in-Glioblastoma-Cell-Lines-pone.0004765.s010.ogv 3.3 s, 480 × 360; 213 KB
-
Human-Mena-Associates-with-Rac1-Small-GTPase-in-Glioblastoma-Cell-Lines-pone.0004765.s011.ogv 3.3 s, 480 × 360; 202 KB
-
-
-
-
In-vivo-single-molecule-imaging-identifies-altered-dynamics-of-calcium-channels-in-dystrophin-ncomms5974-s5.ogv 3.9 s, 1,024 × 512; 6.83 MB
-
-
In-vivo-single-molecule-imaging-identifies-altered-dynamics-of-calcium-channels-in-dystrophin-ncomms5974-s7.ogv 9.5 s, 768 × 1,024; 48.12 MB
-
Intracellular-localization-and-interaction-of-mRNA-binding-proteins-as-detected-by-FRET-1471-2121-11-69-S1.ogv 2 min 36 s, 499 × 316; 7.69 MB
-
-
-
-
-
Multiplexed-3D-FRET-imaging-in-deep-tissue-of-live-embryos-srep13991-s2.ogv 36 s, 610 × 470; 1.14 MB
-
Multiplexed-3D-FRET-imaging-in-deep-tissue-of-live-embryos-srep13991-s3.ogv 35 s, 610 × 270; 512 KB
-
Multiplexed-3D-FRET-imaging-in-deep-tissue-of-live-embryos-srep13991-s4.ogv 36 s, 910 × 420; 1.58 MB
-
Multiplexed-3D-FRET-imaging-in-deep-tissue-of-live-embryos-srep13991-s5.ogv 24 s, 616 × 602; 1.03 MB
-
Multiplexed-3D-FRET-imaging-in-deep-tissue-of-live-embryos-srep13991-s6.ogv 24 s, 686 × 672; 1.41 MB
-
Multiplexed-3D-FRET-imaging-in-deep-tissue-of-live-embryos-srep13991-s7.ogv 24 s, 1,190 × 602; 2.05 MB
-
Multiplexed-3D-FRET-imaging-in-deep-tissue-of-live-embryos-srep13991-s8.ogv 24 s, 1,190 × 602; 2.13 MB
-
Practical-and-reliable-FRETFLIM-pair-of-fluorescent-proteins-1472-6750-9-24-S2.ogv 1.7 s, 804 × 383; 287 KB
-
Real-time-visualization-of-heterotrimeric-G-protein-Gq-activation-in-living-cells-1741-7007-9-32-S4.ogv 4.0 s, 348 × 260; 1.53 MB
-
Rezonancia.jpg 1,000 × 221; 19 KB
-
SET vs FRET.png 3,300 × 2,514; 51 KB
-
SmFRET camerablur.png 1,710 × 1,005; 259 KB
-
SmFRET scheme.png 1,538 × 946; 247 KB
-
SmFRET trajectory.png 1,239 × 953; 239 KB
-
SmFRET trajectory2.png 1,383 × 880; 148 KB
-
SmFRET trajectory3.png 1,383 × 880; 147 KB
-
SmFRET vs. ensemble FRET.png 1,280 × 720; 43 KB
-
-
-
-
Staphylococcal-Enterotoxin-A-Induces-Small-Clusters-of-HLA-DR1-on-B-Cells-pone.0006188.s004.ogv 16 s, 640 × 480; 4.78 MB
-
Staphylococcal-Enterotoxin-A-Induces-Small-Clusters-of-HLA-DR1-on-B-Cells-pone.0006188.s005.ogv 0.0 s, 640 × 480; 36.28 MB
-
Staphylococcal-Enterotoxin-A-Induces-Small-Clusters-of-HLA-DR1-on-B-Cells-pone.0006188.s006.ogv 0.0 s, 640 × 480; 6.89 MB
-
Structural-Heterogeneity-and-Quantitative-FRET-Efficiency-Distributions-of-Polyprolines-through-a-pone.0019791.s003.ogv 1 min 20 s, 480 × 360; 10.73 MB
-
Structural-Heterogeneity-and-Quantitative-FRET-Efficiency-Distributions-of-Polyprolines-through-a-pone.0019791.s004.ogv 1 min 9 s, 480 × 360; 7.43 MB
-
-
-
-
-
-
-
-
-
-
-
-
-
-
-
-
-
-
-
“cAMP-Sponge”-A-Buffer-for-Cyclic-Adenosine-3′-5′-Monophosphate-pone.0007649.s006.ogv 7.4 s, 196 × 137; 717 KB


