Category:Economic charts of Russia
Jump to navigation
Jump to search
Subcategories
This category has the following 2 subcategories, out of 2 total.
I
- Illarionov presentations (3 F)
R
Media in category "Economic charts of Russia"
The following 200 files are in this category, out of 200 total.
-
2012 Russia Products Export Treemap.png 752 × 584; 63 KB
-
Annual dynamics of factoring market.jpg 660 × 538; 65 KB
-
Auto sales 2013.jpg 664 × 308; 38 KB
-
Average natural gas prices.jpg 660 × 378; 53 KB
-
Average per capita income in Russia, 1995-2015.png 842 × 447; 19 KB
-
Az infláció alakulása Oroszországban 2013-2015.png 3,136 × 3,048; 116 KB
-
Bank of Russia reserve graph.svg 780 × 720; 292 KB
-
Bank of russia reserve to 01082013.png 1,049 × 630; 41 KB
-
Bank of russia reserve.png 351 × 592; 11 KB
-
Basic tendencies of investment activity.jpg 398 × 1,024; 93 KB
-
BIP RUS 1991 bis 2014.png 957 × 605; 25 KB
-
Capital outflow Russia since 2008.png 776 × 606; 23 KB
-
Capitalization oil and gas companies.jpg 664 × 308; 27 KB
-
Car leasing in Russia.jpg 660 × 368; 68 KB
-
Car market in Russia and in Europe 2014.jpg 660 × 528; 75 KB
-
Commission of the Russian banks 2.jpg 660 × 285; 60 KB
-
Commission of the Russian banks.jpg 660 × 312; 41 KB
-
Construction costs of the mini-hotel.jpg 660 × 841; 110 KB
-
Consumption of milk in Russia.jpg 660 × 394; 61 KB
-
Deposits in Russia.jpg 664 × 308; 34 KB
-
Dinamika oborota.JPG 1,129 × 584; 61 KB
-
Distribution of Wealth in Russia.svg 800 × 600; 24 KB
-
Dynamics of crediting of small and medium business.jpg 426 × 1,024; 75 KB
-
Dynamics of production of waste in Russia.jpg 660 × 286; 32 KB
-
Dynamics of RNWF 2021.png 2,241 × 1,048; 98 KB
-
Dynamics of sales of new cars in Russia.jpg 660 × 300; 51 KB
-
Dynamics of the IPO in Russia.jpg 660 × 827; 112 KB
-
Dynamics of the Russian market of medical products.jpg 660 × 550; 64 KB
-
Développement de la masse monétaire et de l'inflation en Russie.svg 490 × 270; 16 KB
-
EAEU GDP per capita.svg 1,281 × 641; 168 KB
-
Euro Cbonds Sovereign.png 440 × 270; 8 KB
-
Euro vs Rouble depuis 2010.PNG 1,329 × 676; 44 KB
-
Export of agricultural machinery from Russia.jpg 664 × 308; 24 KB
-
Export Russia-China 2013.jpg 237 × 450; 24 KB
-
Factoring 2014.jpg 660 × 846; 81 KB
-
Fast food in Russia 1.jpg 660 × 1,614; 154 KB
-
Fast food in Russia 2.jpg 661 × 1,535; 133 KB
-
Fast food in Russia 3.jpg 661 × 1,159; 116 KB
-
Fees royalties Russian author's society.jpg 660 × 593; 91 KB
-
FNB Rus 2017.png 542 × 314; 21 KB
-
Foreign Internet-shops in Russia.jpg 660 × 417; 49 KB
-
Franchising in Russia and in the world.jpg 660 × 286; 27 KB
-
Freight transportation Russian Railways.jpg 660 × 287; 38 KB
-
GDP Eurasia.svg 794 × 397; 423 KB
-
Gdp growth Russia.png 783 × 580; 13 KB
-
GDP inhabitants.jpg 725 × 480; 51 KB
-
GDP of Russia since 1989.svg 1,130 × 530; 10 KB
-
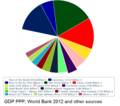
Gdp, ppp world economy 2012.png 747 × 660; 90 KB
-
GDP-top-counties.gif 531 × 311; 28 KB
-
Gdpercapita Russia IMF.png 1,350 × 739; 41 KB
-
Geldmenge und Inflation im Zarenreich.svg 490 × 270; 16 KB
-
Graduates in tertiary education-thousands.jpg 877 × 531; 60 KB
-
Grafico2-BRICs.png 606 × 538; 34 KB
-
Grafico3-BRICs.png 609 × 472; 50 KB
-
Graph bivalutnaya korzina.JPG 1,383 × 824; 109 KB
-
Growth of industrial production in Russia II-2014.jpg 664 × 308; 37 KB
-
HDP PPP per capita Russia.jpg 961 × 624; 81 KB
-
Housing prices in russia.jpg 413 × 297; 22 KB
-
IFX-Cbonds.jpg 440 × 305; 67 KB
-
Import share on the market of medical products in Russia.jpg 660 × 389; 52 KB
-
Imports of goods and services (% of GDP) - 2022 - World Bank.png 400 × 922; 37 KB
-
Inflation in Russia from 2008.png 921 × 771; 10 KB
-
Insurance in Russia.jpg 547 × 600; 53 KB
-
JPN RUS export-import.JPG 970 × 604; 62 KB
-
Labour productivity 2014.jpg 664 × 308; 35 KB
-
Leasing in Russia.jpg 397 × 1,024; 99 KB
-
Level of automation of individual HR processes in Russia.jpg 660 × 568; 75 KB
-
Main costs of mini-hotels.jpg 661 × 815; 116 KB
-
Market of Turkey meat in Russia.jpg 661 × 617; 64 KB
-
Medical devices market in Russia in 2013.jpg 660 × 341; 43 KB
-
Medical products market in Russia.jpg 1,000 × 928; 106 KB
-
MICEX Index graph.png 2,679 × 2,388; 174 KB
-
MICEXCBITR Index Graph.PNG 980 × 641; 33 KB
-
Modeles concurrence.jpg 835 × 158; 106 KB
-
Modeles concurrence.svg 835 × 158; 10 KB
-
Modernization of the Russian textile industry.jpg 660 × 468; 81 KB
-
Moscow-Russia GDP 1997-2002 english.png 640 × 427; 3 KB
-
Moscow-Russia GDP 1997-2002 hungarian.png 640 × 427; 3 KB
-
Number of franchisors in Russia.jpg 660 × 282; 18 KB
-
Oilfield services market in Russia.jpg 660 × 497; 102 KB
-
Oroszország GDPje.png 1,756 × 1,204; 52 KB
-
Overseas online shopping in Russia.jpg 660 × 427; 78 KB
-
Patents by type of activity in Russia.jpg 660 × 312; 71 KB
-
Patents in the regions of Russia.jpg 660 × 671; 131 KB
-
Países mais sancionados.jpg 1,200 × 1,200; 463 KB
-
Petroleum and other liquid fuels production (HY).png 755 × 280; 25 KB
-
Planning start a business.jpg 660 × 403; 31 KB
-
Production and consumption of pork in Russia.jpg 661 × 327; 62 KB
-
Production and imports of cheese in Russia.jpg 660 × 433; 137 KB
-
Production and supply of fish in Russia.jpg 489 × 600; 43 KB
-
Production of fabrics in Russia (2).jpg 660 × 877; 76 KB
-
Production of fabrics in Russia.jpg 660 × 304; 35 KB
-
Proportion of Russians who have a discount card.jpg 660 × 596; 36 KB
-
Pyanse.svg 319 × 319; 40 KB
-
Real estate investments in Russia.jpg 664 × 308; 36 KB
-
Regions with negative dynamics of investments.jpg 660 × 873; 93 KB
-
Reserven russland.svg 777 × 480; 38 KB
-
Revenue TekhnoNIKOL.jpg 660 × 617; 58 KB
-
RezervniFondRuskeFederace.png 570 × 476; 16 KB
-
RF Rus 2017.png 481 × 284; 22 KB
-
RGBEY Index graph.PNG 980 × 641; 43 KB
-
RGBI Index graph.PNG 980 × 641; 45 KB
-
RTS Index graph.png 748 × 372; 12 KB
-
RusFinCris.PNG 1,091 × 691; 40 KB
-
Russia Export Treemap.png 854 × 667; 138 KB
-
Russia External Debt Graph.png 1,643 × 1,064; 227 KB
-
Russia GDP distribution Federal Districts.png 2,290 × 1,058; 132 KB
-
Russia in the index of innovative countries.jpg 664 × 308; 44 KB
-
Russia industrial growth chart YoY.PNG 697 × 418; 31 KB
-
Russia PC Shipments.jpg 8,160 × 5,016; 665 KB
-
Russia Product Export Treemap 2014 zh-cn.svg 1,164 × 598; 441 KB
-
Russia Product Export Treemap.jpg 1,102 × 860; 435 KB
-
Russia Total External Debt Graph RU.svg 639 × 359; 39 KB
-
Russia trade percentage 2013.png 1,200 × 874; 91 KB
-
Russia's wages.jpg 785 × 477; 58 KB
-
Russian airlines by year.png 997 × 697; 436 KB
-
Russian bonds.webp 3,858 × 1,014; 149 KB
-
Russian car market statistics (1999—2023).svg 512 × 148; 97 KB
-
Russian current account.jpg 375 × 219; 16 KB
-
Russian current surplus 2007.jpg 424 × 240; 19 KB
-
Russian e-Commerce.jpg 660 × 292; 33 KB
-
Russian economy since fall of Soviet Union-ar.png 678 × 436; 31 KB
-
Russian economy since fall of Soviet Union-pt.PNG 619 × 388; 29 KB
-
Russian economy since fall of Soviet Union.PNG 678 × 552; 34 KB
-
Russian exports to India - 1995 to 2012.jpg 1,020 × 657; 87 KB
-
Russian Federation Gold Reserves.png 1,206 × 349; 55 KB
-
Russian fund debt2007.jpg 392 × 225; 21 KB
-
Russian gaming market.jpg 660 × 361; 47 KB
-
Russian imports of fish.jpg 436 × 600; 40 KB
-
Russian income.jpg 556 × 354; 40 KB
-
Russian increasing stabfond.png 348 × 252; 7 KB
-
Russian inflation rate 1993-2022.webp 1,538 × 479; 7 KB
-
Russian inflation rate.webp 1,598 × 397; 22 KB
-
Russian invest.jpg 555 × 354; 55 KB
-
Russian investment abroad.jpg 323 × 212; 22 KB
-
Russian monocities.jpg 491 × 1,024; 69 KB
-
Russian oil exports destination.webp 573 × 542; 99 KB
-
Russian public debt.jpg 414 × 250; 20 KB
-
RussiaTotalExternalDebtGraph.png 480 × 289; 6 KB
-
Russiaunemployment.png 1,074 × 590; 73 KB
-
Standard & Poor's rating in Russia (1996-2022).png 793 × 457; 6 KB
-
Standard & Poor’s rating dynamics Russia.png 838 × 729; 84 KB
-
State investments in fixed capital.jpg 660 × 440; 82 KB
-
Structure of expenditures of the Federal budget 2015.jpg 660 × 697; 149 KB
-
Structure of franchising in Russia.jpg 660 × 500; 42 KB
-
Structure of production of fabrics in Russia.jpg 660 × 831; 88 KB
-
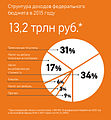
Structure of revenues of the Federal budget 2015.jpg 660 × 711; 137 KB
-
Structure of Russian exports to China.jpg 1,000 × 662; 151 KB
-
Structure of the hotel market in Russia.jpg 660 × 330; 62 KB
-
Structure of the Russian market of medical products.jpg 660 × 686; 55 KB
-
Structure offers apartments.jpg 660 × 425; 60 KB
-
STZAKVVP.png 419 × 279; 16 KB
-
Successful orbital launches.jpg 716 × 408; 70 KB
-
Supply of gas to the domestic market of Russia.jpg 664 × 308; 20 KB
-
TOP 10 SAAS providers in Russia.jpg 660 × 440; 77 KB
-
Top selling cars in Russia in 2014.jpg 660 × 731; 111 KB
-
Tourism from Russia.jpg 664 × 411; 69 KB
-
Trade turnover in January-May 2015.jpg 664 × 308; 30 KB
-
Transactions by industry.jpg 660 × 505; 72 KB
-
Voenrash.png 860 × 325; 13 KB
-
VRP RBaskortostan.jpg 480 × 289; 17 KB
-
Waste in Russia and the EU.jpg 660 × 550; 52 KB
-
Wiki dia BNP.png 740 × 387; 15 KB
-
ZVR Russia.png 1,075 × 759; 56 KB
-
Évolution du PIB et des dépenses de défense de la Russie.png 720 × 540; 86 KB
-
Ввп и санкции.png 651 × 523; 30 KB
-
ВВП РФ с 1990 по 2011 гг.png 864 × 489; 38 KB
-
Ввп12.gif 594 × 377; 19 KB
-
Внешний долг РФ 04 2017.png 1,891 × 721; 108 KB
-
Динамика доллара, 2014-2015.png 800 × 351; 21 KB
-
Динамика евро, 2013-2015.png 818 × 392; 27 KB
-
Динамика индекса промышленного производства в России 1991 – 2018 годах.png 2,400 × 1,511; 746 KB
-
Объём рынка интернет-рекламы России (2001-2010 гг., млн. долл.).JPG 620 × 357; 31 KB
-
Презентация OpenDocument (1).pdf 1,654 × 1,239; 67 KB
-
Презентация OpenDocument (3).pdf 1,654 × 1,239; 89 KB
-
Презентация OpenDocument (5).pdf 1,654 × 1,239; 72 KB
-
Производительность труда в российских нефтяных компаниях.png 531 × 515; 29 KB
-
Реальная начисленная заработная плата 2010.png 554 × 291; 18 KB
-
Рис1.jpg 507 × 262; 23 KB
-
Соотношение ВВП и ВНП России.JPG 569 × 380; 34 KB
-
Ставка рефинансирования ЦБ РФ 1992-2009 гг..jpg 919 × 491; 62 KB
-
Структура экспорта рф.png 434 × 246; 19 KB
-
Товарный экспорт РФ.png 472 × 323; 19 KB
-
中俄PPP3.png 1,309 × 809; 74 KB
-
中俄PPP比较.PNG 1,621 × 486; 47 KB


