Category:Economic charts of Austria
Jump to navigation
Jump to search
Media in category "Economic charts of Austria"
The following 44 files are in this category, out of 44 total.
-
Arbeitslose, Österreich, 1946-2012.jpg 656 × 778; 85 KB
-
Ausstoß nach Gebinde.JPG 590 × 350; 32 KB
-
Austria Export Treemap.jpg 1,105 × 861; 929 KB
-
Austria GDP growth.jpg 718 × 515; 48 KB
-
Austrian Economy 1929-1947.jpg 307 × 471; 56 KB
-
Austrian Economy 1929-1947.png 307 × 471; 107 KB
-
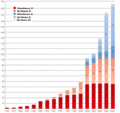
Austrian Economy 1946-1969.svg 744 × 1,052; 254 KB
-
Austrian stock market index.jpg 900 × 651; 124 KB
-
Außenhandel Österreich - Frankreich.png 557 × 223; 10 KB
-
Brp2008bundeslaender 01.png 3,508 × 2,480; 203 KB
-
Bundesfinanzschuld.gif 500 × 339; 33 KB
-
Diagramm 2015 4 mobil austria.tiff 713 × 437; 72 KB
-
Dispgraph 01.png 3,307 × 2,044; 292 KB
-
Distribution of Wealth in Austria.svg 800 × 600; 24 KB
-
Expansion de.gif 329 × 311; 14 KB
-
Handelspartner Ö.png 701 × 301; 15 KB
-
Historische Staatsschuldenquote Österreichs von 2002 bis 2015.jpg 835 × 191; 88 KB
-
ImportExport Österreich Jugoslawien.png 3,969 × 2,381; 201 KB
-
ImportExport Österreich Jugoslawien2.png 992 × 595; 27 KB
-
Jugoslawische Gastarbeiter in Österreich.png 947 × 565; 49 KB
-
Kaltenhausen.JPG 596 × 463; 33 KB
-
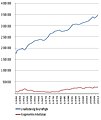
Leistungsbilanz1996 2009.pdf 1,754 × 1,239; 38 KB
-
Luftfrachtentwicklung Flughafen Wien Schwechat 2004-2019 inkl. Trucking.gif 1,896 × 1,236; 42 KB
-
Mitarbeiter de.gif 330 × 412; 8 KB
-
Netto-Direktinvestitionen in Österreich 1997-2008.jpg 400 × 432; 31 KB
-
Netto-Kapitalzuflüsse nach Österreich 2008.jpg 400 × 431; 36 KB
-
Oesterreich Arbeitslosigkeit 1919-1955.svg 913 × 754; 360 KB
-
Passagierzahlen Flughafen Wien 2011 bis 2015.png 279 × 288; 3 KB
-
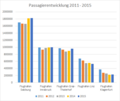
Passagierzahlen Österreich 2011 bis 2015.png 496 × 419; 4 KB
-
Produktion in hl (1850-2.Weltkrieg).JPG 893 × 352; 47 KB
-
Produktion in hl (1950-1975).JPG 878 × 376; 38 KB
-
Saldo 1980-2015.png 294 × 251; 11 KB
-
Sinus Milieus in Deutschland, Österreich und der Schweiz.png 862 × 517; 158 KB
-
Umsatzentwicklung Toto.png 1,816 × 968; 102 KB
-
Unternehmensansiedlungen in Österreich 2000-2008.jpg 400 × 248; 18 KB
-
Verkehrszahlen VIE 2020.png 1,248 × 1,009; 83 KB
-
Verkehrszahlen VIE.png 1,539 × 942; 75 KB
-
Zuschauergrafik Bundesliga Österreich.png 862 × 434; 19 KB
-
Österreich Export-Import 2014-2014-2016.png 740 × 432; 18 KB
-
Österreichische Anteil der Energieträger.svg 650 × 400; 2 KB


