Category:Climate diagrams of the United States
Jump to navigation
Jump to search
Countries of the Americas: Argentina · The Bahamas · Barbados · Belize · Bolivia · Brazil · Canada · Chile · Colombia · Costa Rica · Dominican Republic · Ecuador · El Salvador · Guatemala · Honduras · Jamaica · Mexico · Nicaragua · Paraguay · Peru · United States of America · Uruguay · Venezuela
Other areas: Greenland
Other areas: Greenland
Subcategories
This category has the following 9 subcategories, out of 9 total.
Media in category "Climate diagrams of the United States"
The following 44 files are in this category, out of 44 total.
-
Chicago graph clim.png 1,192 × 1,080; 83 KB
-
CincinnatiOHclim.png 450 × 450; 14 KB
-
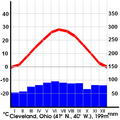
ClevelandOHclim.png 450 × 450; 14 KB
-
Climate Table Los Angeles.png 1,217 × 649; 28 KB
-
Climate-birmingham-alabama.png 455 × 311; 9 KB
-
Climate-huntington-lake.png 455 × 311; 9 KB
-
Climate-san-jose.png 455 × 311; 9 KB
-
ClimateNashvilleTennessee.png 450 × 450; 4 KB
-
ColumbusOHclim.png 450 × 450; 13 KB
-
Extreme weather in the US 1980-2011-tr.png 800 × 536; 494 KB
-
Extreme weather in the US 1980-2011.png 800 × 536; 471 KB
-
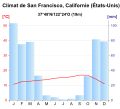
Graph clim San Francisco.svg 521 × 470; 71 KB
-
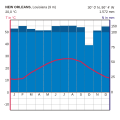
Klimadiagr New orleans.svg 1,063 × 1,063; 77 KB
-
Klimadiagr New york.svg 1,063 × 1,063; 152 KB
-
Klimadiagr Phoenix.svg 1,063 × 1,063; 148 KB
-
Klimadiagr Richmond.svg 1,063 × 1,063; 150 KB
-
Klimadiagr Seattle.svg 1,063 × 1,063; 153 KB
-
Klimadiagr St. louis.svg 1,063 × 1,063; 151 KB
-
Klimadiagramm Anfang.png 1,217 × 649; 25 KB
-
Klimadiagramm Tacoma.jpg 790 × 505; 70 KB
-
Klimadiagramm-San-Francisco.png 800 × 530; 48 KB
-
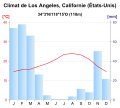
Klimadigr Los angeles.svg 1,063 × 1,063; 79 KB
-
Lake Arrowhead precipitation.jpg 636 × 376; 28 KB
-
Los Angeles Graph clim.svg 521 × 470; 68 KB
-
Los Angelisse kliimadiagramm.png 390 × 491; 12 KB
-
Marine Layer Deep or Shallow Graphic (NWS Los Angeles-Oxnard).jpg 852 × 706; 134 KB
-
Minneapolis Climate Averages.png 613 × 502; 18 KB
-
NASA Tº 1880 2007 W Point.gif 650 × 434; 279 KB
-
NASA Tº 1956 2008 McMurdo, Antártida.gif 650 × 435; 280 KB
-
NASA Tº D'Urvi 1950-2012.gif 662 × 444; 16 KB
-
New York.png 409 × 569; 13 KB
-
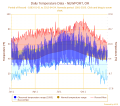
Newport-or-temperature-1893.svg 604 × 533; 215 KB
-
Pennridge Quakertown Classic Temperature Time Series.png 768 × 384; 21 KB
-
Pennridge Quakertown Classic Wind Speed Time Series.png 768 × 384; 22 KB
-
Potential evapotranspiration Hawaii.gif 351 × 163; 35 KB
-
PSM V59 D547 Hourly wind velocity at san francisco.png 1,032 × 1,258; 223 KB
-
PSM V59 D549 Temperature records.png 1,708 × 962; 289 KB
-
PSM V60 D505 Chart of the eastward movement of upper air above washington dc.png 825 × 1,042; 131 KB
-
PSM V60 D508 Winter cyclone in the great lakes region.png 1,601 × 1,172; 138 KB
-
Salt lake city.svg 1,063 × 1,063; 148 KB
-
Temperature in Lake Arrowhead.jpg 864 × 506; 104 KB
-
ToledoOHclim.png 450 × 450; 13 KB
-
Usok0558-climate-walters (1).gif 455 × 311; 12 KB


