Category:Climate diagrams of France
Jump to navigation
Jump to search
Subcategories
This category has the following 3 subcategories, out of 3 total.
- Climate diagrams of Paris (10 F)
- Climate diagrams of Toulouse (5 F)
C
Media in category "Climate diagrams of France"
The following 43 files are in this category, out of 43 total.
-
 10 mars 2010 température maxi en France métropolitaine.png 988 × 883; 193 KB
-
 4 mai 2010 température maxi en France.png 1,280 × 1,024; 327 KB
-
 5 mai 2010 température mini en France.png 988 × 883; 332 KB
-
 9 mars 2010 température maxi en France métropolitaine.png 988 × 883; 192 KB
-
 Albi.png 520 × 321; 20 KB
-
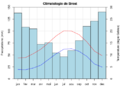
 Climatologie 1971-2000 vannes.png 373 × 338; 20 KB
-
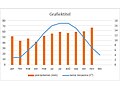
 Diagramme Climatique du Havre.png 1,440 × 696; 43 KB
-
 Ecart tempé 1900-2021.svg 1,164 × 850; 497 KB
-
 ENSOLEILLEMENT FRANCE PARIS.jpg 2,260 × 1,732; 988 KB
-
 FR-Besancon-Diagramme climatique 1971-2000.svg 902 × 542; 543 KB
-
 FR-Besancon-Diagramme climatique 1981-2010.svg 902 × 542; 533 KB
-
 FR-Besancon-Diagramme climatique 1991-2020.svg 902 × 542; 534 KB
-
 FR-Bourg-Saint-Maurice-Diagramme climatique 1971-2000.svg 902 × 542; 543 KB
-
 FR-Bourg-Saint-Maurice-Diagramme climatique 1981-2010.svg 902 × 542; 533 KB
-
 FR-Bourg-Saint-Maurice-Diagramme climatique 1991-2020.svg 902 × 542; 534 KB
-
 FR-Brest-Guipavas-Diagramme climatique 1971-2000.svg 902 × 542; 542 KB
-
 FR-Brest-Guipavas-Diagramme climatique 1981-2010.svg 902 × 542; 538 KB
-
 FR-Brest-Guipavas-Diagramme climatique 1991-2020.svg 902 × 542; 534 KB
-
 FR-Cambrai-Diagramme climatique 1971-2000.svg 902 × 542; 503 KB
-
 FR-Cambrai-Diagramme climatique 1981-2010.svg 902 × 542; 521 KB
-
 FR-Cambrai-Diagramme climatique 1991-2020.svg 902 × 542; 505 KB
-
 FR-Ecart tempé 1900-2022.svg 1,292 × 963; 207 KB
-
 FR-Orleans-Bricy-Diagramme climatique 1971-2000.svg 902 × 542; 531 KB
-
 FR-Orleans-Bricy-Diagramme climatique 1981-2010.svg 902 × 542; 517 KB
-
 FR-Orleans-Bricy-Diagramme climatique 1991-2020.svg 902 × 542; 520 KB
-
 Graphique du climat de Vence.jpg 476 × 357; 31 KB
-
 Graphique Evolution Ta et Th d'un psychromètre.JPG 1,968 × 1,660; 360 KB
-
 Ile-europe-1951-2000-climat-ombrothermique-1.svg 733 × 553; 70 KB
-
 Ile-europe-1951-2000-climat-ombrothermique-2.svg 733 × 553; 67 KB
-
 Indice de rigueur climatiqueClimateIndicator.jpg 1,024 × 768; 96 KB
-
 Le climat Hénin-Beaumont.jpg 482 × 357; 39 KB
-
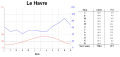 Le-Havre-climat.svg 784 × 370; 28 KB
-
 Les eyzies lgm.png 500 × 480; 10 KB
-
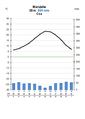 Marsielle kliimadiagramm.png 405 × 569; 16 KB
-
 Neigec en France.png 821 × 942; 172 KB
-
 R-Exemple Climatologie Brest.png 504 × 360; 22 KB
-
 Répartition émissions GES combustion France 2010.jpg 529 × 333; 17 KB
-
 Température mini 8 mars 210 en France métropolitaine.png 988 × 883; 195 KB
-
 Températures France Val de Saône 2010 février mars.png 994 × 600; 45 KB
-
 Weer grafiek henin-beaumont.jpg 482 × 357; 37 KB
-
 Émissions GES combustion France 1990-2010.jpg 567 × 378; 33 KB
-
 Демография Плезира.jpg 853 × 494; 69 KB
-
 Климат Плезир.jpg 723 × 420; 58 KB


