Category:Climate diagrams of Austria
Jump to navigation
Jump to search
Subcategories
This category has only the following subcategory.
C
Media in category "Climate diagrams of Austria"
The following 19 files are in this category, out of 19 total.
-
 Austria Temp (1750-2013).jpg 2,374 × 1,810; 1,004 KB
-
 Austria-TAVG-Trend.svg 1,024 × 640; 466 KB
-
 Blitze-je-qkm-A.png 1,021 × 529; 104 KB
-
 Blitze-je-qkm.png 1,009 × 591; 27 KB
-
 Clima Viena (Austria).PNG 974 × 603; 45 KB
-
 Climate table austria -deutsch-.jpg 1,367 × 873; 89 KB
-
 Histalp-at-tief.png 716 × 482; 31 KB
-
 Jahresmitteltemperatur Verteilung Österreich 1971-2000.png 1,226 × 808; 21 KB
-
 Jahresmitteltemperatur Verteilung Österreich.png 1,227 × 808; 22 KB
-
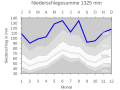 JUNGHOLZ KUEHMOOS nieder q.svg 512 × 384; 21 KB
-
 Klimadaten Kapfenberg.gif 733 × 536; 18 KB
-
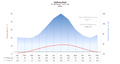
 Klimadiagramm Kapfenberg.svg 4,492 × 2,029; 36 KB
-
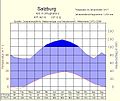
 Klimadiagramm salzburg.png 988 × 527; 38 KB
-
 Klimadiagramm-Salzburg.jpg 613 × 516; 67 KB
-
 Klimadiagramm.jpg 613 × 516; 116 KB
-
 Klimadiagramms (Innsbruck).gif 445 × 271; 6 KB
-
 Klimatabelle Sankt Kathrein im Burgenland.png 1,381 × 378; 65 KB
-
 St. Pölten - Temperatur und Niederschlag 2006.svg 715 × 524; 133 KB
-
 Temperaturdiagramm Österreich.png 1,243 × 546; 36 KB
.jpg)


.PNG)


.gif)

