Category:Carbon dioxide emissions
Jump to navigation
Jump to search
Subcategories
This category has the following 4 subcategories, out of 4 total.
Media in category "Carbon dioxide emissions"
The following 200 files are in this category, out of 280 total.
(previous page) (next page)-
1800- Global carbon dioxide emissions, per person.svg 1,200 × 675; 5 KB
-
1850- Annual emissions of carbon dioxide, by country.svg 1,200 × 675; 20 KB
-
1850- Cumulative emissions of carbon dioxide, by country.svg 1,200 × 675; 17 KB
-
2017 Fossil Carbon Dioxide (CO₂) Emissions by Jurisdiction as % of World Total.jpg 1,233 × 1,283; 279 KB
-
2019 Carbon dioxide emissions by income group - Oxfam data.svg 1,200 × 850; 3 KB
-
2021 Worldwide CO2 Emissions (by region, per capita, growth); variwide diagram.png 3,000 × 2,000; 718 KB
-
A1Tonnes de CO2 émis par habitant et population mondiale cumulé en 2002.png 1,272 × 938; 77 KB
-
A2Pourcentage cumulé de CO2 émis et population mondiale cumulé en 2002.png 1,277 × 934; 84 KB
-
ACEA agreement progress.png 393 × 275; 9 KB
-
Annual CO2 emissions by region, 2022 (%).png 3,400 × 2,400; 847 KB
-
Annual CO2 emissions by region, 2022.png 3,400 × 2,400; 777 KB
-
Annual CO₂ emissions in 2016 vs. 1990, OWID.svg 850 × 600; 41 KB
-
Annual total CO₂ emissions, by world region, OWID.svg 850 × 600; 108 KB
-
Annual-co2-cement (OWID 0052).png 850 × 600; 48 KB
-
Annual-co2-coal (OWID 0051).png 850 × 600; 97 KB
-
Annual-co2-emissions-per-continent.svg 850 × 600; 79 KB
-
Annual-co2-emissions-per-country (1).png 3,400 × 2,400; 431 KB
-
Annual-co2-emissions-per-country.svg 850 × 600; 65 KB
-
Annual-CO2-emissions-Treemap-2017.png 5,473 × 4,995; 1.18 MB
-
Asean-co2-emissions-per-capita.png 3,400 × 2,706; 545 KB
-
ATonnes de CO2 émis par habitant en 2002.png 1,279 × 934; 67 KB
-
B1Tonnes de CO2 émis par habitant et population mondiale cumulé en 2002.png 1,276 × 935; 87 KB
-
B2Pourcentage cumulé de CO2 émis et population mondiale cumulé en 2002.png 1,248 × 938; 36 KB
-
BTonnes de CO2 émis par habitant en 2002.png 1,280 × 941; 94 KB
-
C1Tonnes de CO2 émis par habitant et population mondiale cumulé en 2002.png 1,276 × 937; 73 KB
-
C2Pourcentage cumulé de CO2 émis et population mondiale cumulé en 2002.png 1,264 × 867; 36 KB
-
Cambodia CO2 emissions chart until 2019.png 3,400 × 2,400; 431 KB
-
Canada Per capita CO, emissions 1790-2022.png 3,392 × 2,378; 432 KB
-
Carbon dioxide (CO₂) emissions by sector or source, OWID.svg 850 × 600; 17 KB
-
Carbon dioxide emission from streams and rivers.png 746 × 458; 356 KB
-
Carbon dioxide EMISSION.png 797 × 463; 18 KB
-
Carbon dioxide emissions by income level, OWID.svg 850 × 600; 13 KB
-
Carbon dioxide emissions by sector, OWID.svg 850 × 600; 14 KB
-
Carbon Dioxide Emissions Factor, kg CO₂ per MWh, OWID.svg 850 × 600; 9 KB
-
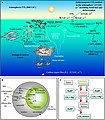
Carbon dioxide emissions global carbon cycle.jpg 2,998 × 2,248; 1.01 MB
-
Carbon dioxide emissions-01.svg 512 × 410; 3 KB
-
Carbon Dioxide Partitioning-cs.svg 960 × 696; 561 KB
-
Carbon Dioxide Partitioning.svg 960 × 696; 57 KB
-
Carbon Emis by Region.es.jpg 551 × 402; 30 KB
-
Carbon emission intensity of economies, OWID.svg 850 × 600; 5 KB
-
Carbon Emissions from Fires- Jan 2003 - Jan 2022 (SVS5012).jpg 800 × 800; 364 KB
-
Carbon Emissions from Fires- Jan 2003 - Jan 2022 (SVS5012).webm 1 min 24 s, 4,096 × 2,048; 16.6 MB
-
Carbon footprint icon.png 886 × 1,125; 45 KB
-
Carbon forms and interactions in freshwater ecosystems.jpg 1,808 × 1,058; 112 KB
-
Carbon History and Flux Rev.png 642 × 800; 32 KB
-
Carbon intensity of GDP (using PPP) for different regions, 1982-2011.png 1,200 × 671; 49 KB
-
Carbon LifeCycleAnalysis LNGCCvsCoal fr.svg 684 × 382; 53 KB
-
Carbon sequestration-2009-10-07.es.png 574 × 451; 122 KB
-
Carbon sequestration-2009-10-07.hr.png 640 × 507; 128 KB
-
Carbon sequestration-2009-10-07.svg 530 × 420; 208 KB
-
Carbon sequestration-NL.svg 530 × 420; 235 KB
-
Carbon sequestration.jpg 360 × 271; 28 KB
-
Carbon Sources and Sinks.svg 960 × 696; 6 KB
-
Carbon-dioxide-emissions-are-higher-in-richer-countries (OWID 0127).png 850 × 600; 103 KB
-
CarbonEmissionsAndGDP.png 976 × 637; 32 KB
-
CCU vs CCS.png 1,076 × 630; 21 KB
-
CO-Anteil 2014.jpg 492 × 324; 48 KB
-
Co-emissions-per-capita-vs-population-growth (OWID 0148).png 850 × 600; 97 KB
-
CO-Quadrat-neutrales Fahren, 1.jpg 4,400 × 2,800; 3.68 MB
-
Co2 1990,2012 (Polish description).png 1,000 × 1,324; 83 KB
-
Co2 by country.png 745 × 1,118; 55 KB
-
Co2 cumulative emissions 1970-2013.svg 680 × 800; 16 KB
-
CO2 emission pie chart as.svg 540 × 540; 8 KB
-
CO2 emission pie chart-gu.svg 432 × 432; 7 KB
-
CO2 emission pie chart-hi.svg 540 × 540; 30 KB
-
CO2 emission pie chart-kn.svg 556 × 504; 38 KB
-
CO2 emission pie chart-ml.svg 540 × 540; 32 KB
-
CO2 emission pie chart-mr.svg 556 × 504; 37 KB
-
CO2 emission pie chart-ne.svg 432 × 432; 13 KB
-
CO2 emission pie chart-ta.svg 540 × 540; 33 KB
-
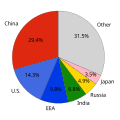
CO2 emission pie chart.svg 540 × 540; 76 KB
-
CO2 emission pie chart.te.svg 432 × 432; 12 KB
-
CO2 Emissionen Moving Average.png 2,375 × 1,493; 104 KB
-
CO2 emissions by country (36041298364).jpg 1,900 × 1,460; 269 KB
-
CO2 Emissions by country.jpg 1,817 × 1,325; 501 KB
-
CO2 emissions by fuel type, Russia.jpg 3,400 × 2,400; 156 KB
-
CO2 Emissions by Source Since 1880-cs.svg 960 × 635; 29 KB
-
CO2 Emissions by Source Since 1880-da.svg 960 × 635; 22 KB
-
CO2 Emissions by Source Since 1880-vi.svg 960 × 635; 31 KB
-
CO2 emissions for PC, IGCC, and NGCC cases.jpg 872 × 597; 51 KB
-
CO2 emissions Germany.svg 850 × 600; 46 KB
-
CO2 Emissions in 1990 and 2012 de.svg 680 × 900; 26 KB
-
CO2 Emissions in 1990 and 2012-IT.svg 680 × 900; 33 KB
-
CO2 emissions of China.svg 850 × 667; 37 KB
-
CO2 Emissions of France.svg 850 × 600; 44 KB
-
CO2 Emissions per Capita by Country 1960-2014 (44289538250).jpg 1,920 × 1,080; 129 KB
-
CO2 emissions USA.svg 850 × 600; 45 KB
-
CO2 emissions visualized for 202102.jpg 720 × 480; 145 KB
-
CO2 emissions vs GDP.svg 850 × 600; 60 KB
-
CO2 emissions, GDP & temperature by country 1961-2014 (32308286658).jpg 1,920 × 1,080; 119 KB
-
Co2 ja ydinvoima.png 754 × 721; 4 KB
-
CO2 reductions needed to keep global temperature rise below 2C 1950 - 2100.png 3,400 × 2,400; 1.04 MB
-
CO2&NPPs.png 808 × 629; 187 KB
-
Co2+methane-US.png 1,052 × 759; 71 KB
-
Co2-1990-2012.svg 680 × 900; 10 KB
-
Co2-1990-2012cy.svg 680 × 900; 33 KB
-
Co2-2013-top40.svg 680 × 800; 16 KB
-
CO2-417k.png 1,200 × 809; 16 KB
-
CO2-by-source (OWID 0142).png 850 × 600; 58 KB
-
Co2-concentrations.jpg 800 × 1,000; 127 KB
-
CO2-Emission von 1900-2018.png 756 × 425; 21 KB
-
CO2-Emissionen 1940-2023.png 1,124 × 795; 89 KB
-
CO2-emissions-by-income-and-region-768x774.png 5,352 × 5,394; 821 KB
-
CO2-emissions-per-capita-map.png 3,400 × 2,706; 1,002 KB
-
CO2-emissions-per-capita.png 3,400 × 2,706; 767 KB
-
CO2-Emmission von 1900-2019.png 756 × 425; 18 KB
-
Co2-international-aviation (OWID 0191).png 850 × 600; 101 KB
-
Co2-per-capita-vs-renewable-electricity (OWID 0183).png 850 × 600; 100 KB
-
CO2-Stripes-1.png 5,000 × 5,000; 465 KB
-
CO₂ emissions by sector, World.svg 850 × 600; 52 KB
-
CO₂ emissions per capita vs GDP per capita, OWID.svg 850 × 600; 31 KB
-
Cumulated CO2 Emissions.jpg 1,554 × 1,182; 897 KB
-
Cumulative CO2 emission by world region.png 1,014 × 597; 54 KB
-
Cumulative CO2 emissions (36811264996).jpg 2,560 × 1,390; 147 KB
-
Cumulative CO2 Emissions By Country (36753397952).jpg 1,900 × 1,460; 275 KB
-
Cumulative CO2 Emissions by Country Since 1850 (31153697117).jpg 1,920 × 1,080; 130 KB
-
Cumulative CO2 emissions by region, 2022.png 3,400 × 2,400; 695 KB
-
Cumulative per person emissions by world region in 3 time periods.png 1,085 × 588; 54 KB
-
Cumulative-co2-fuel (OWID 0217).png 850 × 600; 52 KB
-
Deforestation-co2-trade-by-product.svg 850 × 600; 28 KB
-
ECDM 20230508 WF Amazonia fires.pdf 1,625 × 1,125; 616 KB
-
Emissions CO2 par hab 1990-2006.svg 542 × 426; 114 KB
-
Emissions CO2 USA 1990-2007.svg 728 × 526; 106 KB
-
Energy-related-co2-emissions-per-capita-by-income-decile-by-regions-2021.png 1,200 × 1,000; 27 KB
-
FijiCO2Emissions.png 652 × 481; 21 KB
-
Fossil fuel CO2 Turkey.svg 576 × 432; 42 KB
-
Ga sandpc2.png 1,975 × 1,575; 1.31 MB
-
Ghg-co2-2012.svg 680 × 900; 25 KB
-
Gibraltar Carbon Dioxide Emissions 2007.png 931 × 661; 10 KB
-
Global annual CO2 emissions by world region since 1750.svg 850 × 600; 121 KB
-
Global annual CO2 emissions.png 3,400 × 2,400; 220 KB
-
Global carbon dioxide emission 1990-2008.png 600 × 420; 18 KB
-
Global carbon dioxide emission 1990-2010.png 670 × 420; 20 KB
-
Global Carbon Dioxide, July 2003 (8343180142).jpg 755 × 714; 72 KB
-
Global Carbon Emission by Type to Y2004 ru.png 555 × 466; 47 KB
-
Global Carbon Emissions-ar.svg 2,048 × 1,536; 92 KB
-
Global Carbon Emissions-tr.svg 2,048 × 1,536; 57 KB
-
Global Carbon Emissions.png 310 × 233; 14 KB
-
Global Carbon Emissions.svg 600 × 455; 15 KB
-
Global carbon stocks.png 2,550 × 1,053; 115 KB
-
Global co2 emissions graph.png 549 × 402; 11 KB
-
Global CO₂ intensity, 1820-2014, OWID.svg 850 × 600; 7 KB
-
Global-co2-emissions-fossil-land (OWID 0465).png 850 × 600; 54 KB
-
Global-CO2-emissions-from-aviation.png 1,505 × 1,195; 131 KB
-
Globális szénhidrogén-kibocsátás 1800–2000.jpg 600 × 440; 35 KB
-
InegalitesChancelPiketty500.jpg 500 × 474; 42 KB
-
INSTALLATION-IMAG0014.JPG 800 × 600; 141 KB
-
Internetbos.jpg 2,803 × 1,888; 1.25 MB
-
Ireland v EU-27 v World per capita CO2 emissions.svg 850 × 600; 42 KB
-
Kaya-identity-co2.svg 850 × 600; 46 KB
-
Klimaegalitarismus 01.gif 1,341 × 829; 115 KB
-
Kurzerklärt - Klimaproblem der Moore - Tagesschau.webm 47 s, 1,080 × 1,920; 22.9 MB
-
Kyoto-Related Fossil-Fuel Carbon Dioxide Emissions 1990-2007.svg 578 × 434; 13 KB
-
New Zealand co2 percapita compared.svg 506 × 434; 10 KB
-
New Zealand per capita co2 comparisons.svg 506 × 361; 5 KB
-
Norges CO2-utslipp.png 1,580 × 1,034; 95 KB
-
NorthKoreaPerCapitaCO2.png 600 × 390; 28 KB
-
Ocean carbon cycle and diatom carbon dioxide concentration mechanisms 2.jpg 3,967 × 3,120; 1.95 MB
-
Ocean carbon cycle and diatom carbon dioxide concentration mechanisms.jpg 3,967 × 4,530; 1.02 MB
-
Partitionnement du dioxyde de carbone.svg 960 × 696; 561 KB
-
Pathways for carbon dioxide and methane emissions from mangrove forests.webp 2,609 × 1,818; 1.33 MB
-
Per capita CO2 emissions, Greece.png 1,442 × 976; 158 KB
-
Per capita CO₂ emissions in 2016 vs 1990, OWID.svg 850 × 600; 37 KB
-
Per-capita-co-emissions-vs-human-development-index.svg 850 × 696; 84 KB
-
Per-capita-co2-by-fuel (OWID 0792).png 850 × 600; 62 KB
-
Per-capita-co2-fuel (OWID 0786).png 850 × 600; 42 KB
-
Per-capita-co2-international-flights-adjusted (OWID 0783).png 850 × 600; 118 KB


