Category:Carbon dioxide
Jump to navigation
Jump to search
Nederlands: Koolstofdioxide
Українська: Діоксид вуглецю
chemical compound | |||||
| Upload media | |||||
| Pronunciation audio | |||||
|---|---|---|---|---|---|
| Instance of |
| ||||
| Subclass of | |||||
| Part of |
| ||||
| Discoverer or inventor | |||||
| Has use | |||||
| Mass |
| ||||
| |||||
Subcategories
This category has the following 27 subcategories, out of 27 total.
#
- Videos of carbon dioxide (28 F)
A
B
- CO2 on banners and signs (18 F)
C
- Carbon dioxide bath (empty)
D
E
G
I
- IR carbon dioxide (2 F)
L
- Liquid carbon dioxide (6 F)
M
- Carbon dioxide on Mars (2 F)
O
- Ocean acidification (51 F)
R
S
Media in category "Carbon dioxide"
The following 200 files are in this category, out of 208 total.
(previous page) (next page)-
De-Kohlendioxid.ogg 2.0 s; 19 KB
-
De-Kohlendioxyd.ogg 2.0 s; 20 KB
-
De-Kohlendioxyd2.ogg 2.0 s; 20 KB
-
De-Kohlenstoffdioxid.ogg 2.4 s; 22 KB
-
De-Kohlensäure.ogg 2.0 s; 17 KB
-
1 Tonne Co2.JPG 2,288 × 1,712; 793 KB
-
2.Verfeinerung.png 1,325 × 798; 118 KB
-
3-Sulfolen-3-carbonsäure Synthese.svg 278 × 80; 25 KB
-
A popular chemistry; (1887) (14592800828).jpg 1,224 × 896; 268 KB
-
Alveolar wall.jpg 1,000 × 800; 194 KB
-
Alveolar Wall.svg 938 × 750; 24 KB
-
Alveolus.jpg 952 × 592; 147 KB
-
Annual mean sea surface alkalinity for the 1990s (GLODAP).png 1,612 × 1,133; 283 KB
-
Annual mean sea surface dissolved inorganic carbon for the 1990s (GLODAP).png 1,687 × 1,133; 303 KB
-
AnteileDerKohlensäureformen.svg 1,097 × 1,048; 7 KB
-
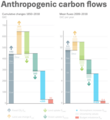
Anthropogenic carbon flows 1850-2018.png 2,067 × 2,253; 157 KB
-
APES Wikipedia Figure Project (2).png 960 × 540; 32 KB
-
APES Wikipedia Figure Project.png 960 × 540; 23 KB
-
Balloons filling with yeast produced CO2 (8029732367).jpg 4,608 × 3,072; 2.05 MB
-
Balloons filling with yeast produced CO2 (8029733505).jpg 4,284 × 2,856; 1.34 MB
-
Beer gas arrives by tanker nowadays.jpg 1,200 × 900; 363 KB
-
Beispiele zur Betrachtung der Polarität der Bindungen mit MEP.svg 1,407 × 525; 575 KB
-
Biological pump hg.png 1,155 × 806; 333 KB
-
C+O2=CO2.svg 325 × 180; 38 KB
-
Capture d’écran 2016-01-17 à 03.31.48.png 1,148 × 204; 226 KB
-
Carbon capture and storage.png 1,000 × 1,001; 232 KB
-
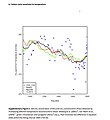
Carbon cycle sensitivity to temperature in 1000-1800.jpg 750 × 817; 76 KB
-
Carbon dioxide and water.jpg 1,440 × 1,080; 33 KB
-
Carbon dioxide clouds over Mont Mercou, Curiosity Sol 3063 (53100058892).jpg 8,181 × 3,302; 11.93 MB
-
Carbon Dioxide Molecular Orbitals.png 1,030 × 1,004; 142 KB
-
Carbon dioxide p-T phase diagram - Ar.png 610 × 620; 37 KB
-
Carbon dioxide pipeline warning sign.JPG 5,303 × 3,603; 6.91 MB
-
Carbon Dioxide radiative forcing.png 700 × 570; 58 KB
-
Carbon dioxide sign.jpg 3,888 × 5,184; 3.2 MB
-
Carbon dioxide Structural Formula V1.svg 126 × 29; 6 KB
-
Carbon dioxide symbol.svg 96 × 96; 832 bytes
-
Carbon dioxide vent at Salton Sea.jpg 2,337 × 1,554; 3.84 MB
-
Carbon dioxide.svg 320 × 107; 4 KB
-
Carbon flow new.jpg 400 × 200; 11 KB
-
Carbon flow.jpg 1,200 × 600; 46 KB
-
Carbon mitigation target cost new.jpg 800 × 354; 33 KB
-
Carbon mitigation target cost.jpg 933 × 413; 42 KB
-
Carbon Storage at sea.svg 4,200 × 2,444; 4.68 MB
-
Carbon stores and fluxes in present day ice sheets.webp 2,052 × 1,074; 101 KB
-
Carbon-dioxide-crystal-3D-balls.png 1,100 × 1,067; 468 KB
-
Carbon-dioxide-crystal-3D-vdW.png 1,100 × 1,066; 458 KB
-
Carbon-dioxide-elpot.png 996 × 658; 336 KB
-
Carbon-dioxide-isotopes-through-time.gif 703 × 1,440; 77 KB
-
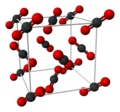
Carbon-dioxide-unit-cell-3D-balls.png 1,100 × 1,031; 331 KB
-
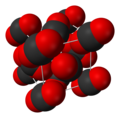
Carbon-dioxide-unit-cell-3D-vdW.png 1,100 × 1,079; 291 KB
-
Carbon-exchange-and-loss-process-pia20163 (1).jpg 1,000 × 1,650; 506 KB
-
Carbonat.jpg 2,105 × 1,435; 308 KB
-
Carbonate Bjerrum.gif 462 × 290; 9 KB
-
Carbonate system of seawater.svg 540 × 334; 23 KB
-
Cellular Respiration Simple.png 2,037 × 674; 86 KB
-
Ceodos.png 781 × 275; 11 KB
-
CNX Chem 18 03 CO2vsSiO2.png 1,014 × 986; 790 KB
-
CO e CO2 struttura di Lewis.jpg 2,032 × 278; 54 KB
-
CO2 & pH.png 2,000 × 2,000; 636 KB
-
CO2 an einem Tag ohne Diesel.png 750 × 449; 11 KB
-
CO2 and CS2.png 819 × 460; 4 KB
-
CO2 AO Diagram.jpg 2,484 × 2,192; 189 KB
-
CO2 Ausstoß an einem Tag mit allen Verkehrsmitteln.png 602 × 395; 8 KB
-
Co2 Ausstoß in t nach Fahrzeugart insgesamt in Frankfurt am Main Verkehr.png 1,169 × 780; 105 KB
-
CO2 Ausstoß in t Prognose Verfeinerung Darstellung.png 1,221 × 591; 95 KB
-
Co2 Ausstoß nach Fahrzeugart.png 1,322 × 652; 69 KB
-
Co2 carbon dioxide icon.png 2,000 × 2,000; 62 KB
-
CO2 diffusion.JPG 3,216 × 4,288; 3.63 MB
-
CO2 Emission Verkehr in t in Frankfurt am Main 2011-2030.png 816 × 442; 52 KB
-
CO2 für die Erde.webm 1 min 1 s, 1,920 × 1,080; 17 MB
-
Co2 hoa lop 11 nc.png 498 × 472; 36 KB
-
CO2 Monitor 3D.png 3,024 × 4,032; 331 KB
-
CO2 pump hg-bn.svg 720 × 505; 47 KB
-
CO2 pump hg-fr.svg 720 × 505; 46 KB
-
CO2 pump hg-hi.svg 720 × 505; 48 KB
-
CO2 pump hg-te.svg 720 × 505; 47 KB
-
CO2 pump hg.png 1,155 × 806; 184 KB
-
CO2 pump hg.svg-mr.svg 720 × 505; 47 KB
-
CO2 Quadrupole-Quadrupole Interaction Schematic.png 665 × 1,436; 48 KB
-
CO2 reduction in electrochemistry.png 1,708 × 1,478; 416 KB
-
CO2 Reduction Mechanism.jpg 558 × 324; 26 KB
-
CO2 Scrubber (4BCO2) unit (MSFC-202100245).tif 4,304 × 5,504; 45.58 MB
-
CO2 Supercritical state.webm 41 s, 1,920 × 1,080; 27.57 MB
-
CO2 Total Emissions By Region 2000-2023.png 1,200 × 1,000; 74 KB
-
CO2 und Temperatur.png 726 × 425; 11 KB
-
CO2 use in 2015 - IEA.png 761 × 585; 114 KB
-
Co2-2.png 911 × 1,154; 35 KB
-
Co2-concentrations.jpg 800 × 1,000; 127 KB
-
Co2-long-term-concentration.png 3,400 × 2,400; 655 KB
-
Co2pctrp.png 549 × 335; 16 KB
-
CO2sidumine.jpg 530 × 420; 97 KB
-
Cochons-gaz-abattage.jpg 1,400 × 788; 269 KB
-
Common molecules and atoms.png 1,616 × 1,344; 402 KB
-
Common molecules and atoms.svg 1,616 × 1,344; 4 KB
-
CONCO2SC.png 896 × 254; 5 KB
-
Critical carbon dioxide-2.jpg 1,704 × 2,272; 1.27 MB
-
Critical carbon dioxide-3.jpg 1,314 × 2,247; 739 KB
-
Critical carbon dioxide.jpg 1,704 × 2,272; 1.04 MB
-
Critical Point of Carbon Dioxide CO2.webm 9 min 20 s, 1,820 × 1,080; 301.14 MB
-
Cumulated Carbonyl EXAMPLE C V.2.svg 193 × 225; 14 KB
-
Cyclohexan+Kohlendioxid-PSRK-Vorhersage.png 444 × 444; 26 KB
-
Dagálysétány Straße, Kanaldeckel, Ammonium, Kohlendioxid, 2021 Vizafogó.jpg 2,272 × 1,704; 996 KB
-
Degaser pump.jpg 632 × 482; 21 KB
-
Degassingpump.jpg 960 × 720; 41 KB
-
DIC speciation.png 774 × 609; 34 KB
-
Dioxido de carbono formacion.png 947 × 96; 5 KB
-
Dioxyde de carbone.png 292 × 138; 48 KB
-
Dissolution Storage.jpg 1,050 × 571; 82 KB
-
DMEU Synthese mit Kohlendioxid.svg 650 × 91; 45 KB
-
Engineers Clean JWST Secondary Reflector with Carbon Dioxide Snow.jpg 4,546 × 2,989; 2.07 MB
-
Estimated annual mean sea surface dissolved inorganic carbon for the 1700s (GLODAP).png 1,687 × 1,133; 307 KB
-
Estimated annual mean sea surface pH for the 1990s (GLODAP).png 1,654 × 1,133; 357 KB
-
Estimated change in annual mean sea surface carbonate ion from 1770s-1990s (GLODAP).png 1,667 × 1,133; 249 KB
-
Estructura de Lewis de dióxido de carbono.svg 1,122 × 793; 11 KB
-
Ethylencarbonat Reaktionsschemata.svg 524 × 184; 13 KB
-
Fasi volume espirato - 2019-07-03 - Davide Marzorati.png 787 × 791; 43 KB
-
Fermentation- Collecting The CO2 Produced (384591703).jpg 1,280 × 960; 144 KB
-
Fermentation- Collecting The CO2 Produced (384591746).jpg 960 × 1,280; 348 KB
-
Fill a gas jar with expired air.png 2,447 × 1,684; 60 KB
-
Foote sunsrays.jpg 2,200 × 2,033; 682 KB
-
Formula condensata vs Lewis.png 960 × 220; 32 KB
-
Fosil yakıt CO2 Türkiye.svg 576 × 432; 45 KB
-
Gasbläschen -- 2022 -- 9759.jpg 6,720 × 4,480; 8.54 MB
-
Global carbon budget components.png 2,067 × 2,597; 341 KB
-
Global CO₂ atmospheric concentration, OWID.svg 850 × 600; 15 KB
-
Glycerincarbonat Direktsynthese.svg 423 × 60; 24 KB
-
Greenhouse gas absorption coefficients.svg 576 × 432; 747 KB
-
Greenhouse gas trends.jpg 1,860 × 455; 178 KB
-
Greenhouse gases seasonal cycles.jpg 762 × 803; 188 KB
-
Huella de carbono.pdf 1,239 × 1,752, 4 pages; 293 KB
-
Hägg-Diagramm Kohlensäure.svg 474 × 429; 15 KB
-
IAA Summit 2023, Munich (P1110853).jpg 4,608 × 3,456; 5.68 MB
-
Information plate on a tree in Japan 2013-03-23.jpg 6,000 × 4,000; 14 MB
-
Irga2.tif 819 × 367; 11 KB
-
Isotopic structure of CO2 and MgCO3.pdf 2,000 × 1,125; 29 KB
-
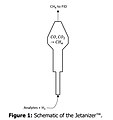
Jetanizer diagram.jpg 403 × 427; 18 KB
-
Karbonatsystem Meerwasser de.svg 540 × 334; 23 KB
-
Karbonatsystem Meerwasser ru.svg 726 × 464; 2 KB
-
Karbonisierung von Wasser zur Getränkeherstellung.jpeg 126 × 203; 7 KB
-
Kristallstruktur-Kohlenstoffdioxid.png 929 × 849; 107 KB
-
Lake nyos co2 vent (cropped).jpg 1,428 × 1,040; 539 KB
-
Lake nyos co2 vent.jpg 1,428 × 1,071; 609 KB
-
Lake oxygen and carbon dioxide.png 2,560 × 1,920; 75 KB
-
LewisCO2.jpg 240 × 194; 5 KB
-
Liquid carbon dioxide generator, Thilorier (1834).JPG 504 × 457; 48 KB
-
Liquid carbon dioxide jets 01.png 1,534 × 1,928; 1.94 MB
-
Liquid carbon dioxide jets 02.png 2,065 × 605; 1.04 MB
-
Liquid CO2 tubes.jpg 400 × 427; 26 KB
-
LogCO2VaporPressure.png 587 × 426; 3 KB
-
Longwave Absorption Coefficients of H2O and CO2.svg 576 × 432; 262 KB
-
Main symptoms of carbon dioxide toxicity-Ar.png 1,195 × 1,033; 468 KB
-
Main symptoms of carbon dioxide toxicity.svg 1,196 × 1,033; 686 KB
-
Meyers b11 s0653.jpg 800 × 1,275; 346 KB
-
Meyers b11 s0654.jpg 800 × 1,275; 430 KB
-
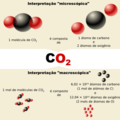
Mol e molécula.png 500 × 500; 88 KB
-
Mostafa Sherbiny.jpg 720 × 1,081; 60 KB
-
Net Ecosystem Exchange of Carbon Dioxide (SVS5047).webm 1 min 0 s, 3,840 × 2,160; 14.18 MB
-
Orange Crush Ad 1921.png 818 × 1,198; 1.32 MB
-
Orsat-Apparat zur Gasanalyse Zucker-Museum.jpg 1,320 × 2,124; 1.66 MB
-
Oxid uhličitý.PNG 628 × 164; 193 KB
-
Portable safety shower-Specifications.jpg 2,048 × 258; 134 KB
-
Predicted effects of elevated carbon dioxide on soil carbon reserves.jpg 3,600 × 2,387; 998 KB
-
Processes in the thermal degredation of organic matter.svg 904 × 786; 6 KB
-
Produção da Acetona (processo Di-e-Di).png 657 × 459; 11 KB
-
Produção da Acetona (processo Di-e-Di)2.png 817 × 470; 22 KB
-
Prognose und Konfidenzintervalle CO2 Ausstoß in t 2021 bis 2030.png 768 × 395; 50 KB
-
Prognose und Konfidenzintervalle für 2021 bis 2030.png 624 × 274; 37 KB
-
Proposed marine carbon dioxide removal options.jpg 1,084 × 586; 369 KB
-
Quadre equilibris heterogenis..png 664 × 260; 15 KB
-
Residual Storage.jpg 1,044 × 571; 103 KB
-
S41467-019-08824-8.pdf 1,239 × 1,629, 8 pages; 1.49 MB
-
Scheme 1 Coordination chemistry of carbon dioxide.jpg 410 × 153; 9 KB
-
ShimadaK2007Sept09-MentosGeyser DSC 3294++.JPG 1,744 × 2,680; 962 KB
-
Soda bubbles macro.jpg 750 × 500; 50 KB
-
Solubility-co2-water.png 388 × 363; 16 KB
-
Sulfurbubbles, Brimstone Pit (NW Rota-1), 2006.jpg 2,048 × 1,536; 2.62 MB
-
Synthetic Venus atmosphere absorption spectrum.gif 972 × 391; 14 KB
-
Test CO2 eau de chaux.png 647 × 205; 18 KB
-
Trinkwasserbesprudler.jpg 1,616 × 2,736; 1.26 MB
-
UK CO2 emissions by sector (1990-2019).png 3,360 × 2,028; 221 KB
-
Universal-CO2-Zylinder verschiedener Abfüller.jpg 4,000 × 3,000; 6.22 MB
-
Verfeinerung nach Fahrzeugart.png 1,039 × 665; 94 KB
-
Vergleich Co2 Ausstoß pro Fahrzeug jährlich Benziner-Diesel-Elektro.png 1,172 × 752; 78 KB
-
Verteilung CO2 Ausstoß in t Frankfurt am Main 2020.png 1,155 × 798; 107 KB
-
Verteilung CO2 Ausstoß in t Frankfurt am Main Mittelwert.png 1,261 × 798; 92 KB
-
Vertically integrated anthropogenic dissolved inorganic carbon 1990s (GLODAP).png 1,637 × 1,133; 403 KB
-
Vollständige Verbrennung von Propan.svg 391 × 85; 14 KB
Categories:
- Carbon oxides
- Acidic oxides
- Coolants
- Medical gases
- Carboxylic anhydrides
- Fire suppression agents
- Greenhouse gases
- Household chemicals
- Inorganic solvents
- Laser gain media
- Nuclear reactor coolants
- Propellants
- Refrigerants
- Gaseous signaling molecules
- Heteroallenes
- Inorganic carbon compounds
- Industrial gases
- Triatomic molecules


