William Playfair
Jump to navigation
Jump to search
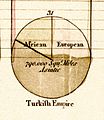
William Playfair (22 September 1759 – 11 February 1823) was a Scottish engineer and political economist who made important innovations in the field of information graphics. Playfair, who argued that charts communicated better than tables of data, has been credited with inventing the line graphs, bar charts, and pie charts. His time series plots are still presented as models of clarity.
Types of charts
[edit]-
Barchart, 1786.
-
Line chart, 1786
-
Interest of the National Debt, 1786
-
Thematic map, 1793
-
Piecharts, 1801.
-
Piecharts, 1801.
-
Barchart, 1822.
-
Line chart or "Linear Chronology," 1824
History
[edit]The Commercial and Political Atlas, 1786
[edit]-
Table of Content (edition 1801)
-
1. All the import and exports to and from England
-
2. Ireland
-
3. East Indies
-
4. West Indies
-
5. North America
-
6. France
-
7. Spain
-
8. Germany
-
9. Flanders
-
12. Denmark & Norway from 1700 to 1780
-
16. Africa
-
16. Guernsey, Jersey and Alderney
-
import and exports of England to and from all North America from the year 1770 to 1782
-
Exports and Imports of Scotland to and from different parts for one Year from Christmas 1780 to Christmas 1781
Financial part
[edit]-
19. Annual Revenues of England and France
-
20. National Debt of England
-
21. Reduction of the national debt by the Sinking Fund already Established
-
23. Expense of the Ordnance
-
24. Expenditure of the British Army
-
25. Interest of the national Debt from the Revolution
The series of chart were republished in William Playfair. Lineal arithmetic, Applied to Shew the Progress of the Commerce and Revenue of England During the Present Century. 1798. The second part was then called "National finances ".
The Statistical Breviary, 1801
[edit]-
Piecharts, 1801.
-
Piecharts, 1801.
Other images
[edit]-
Tableaux d'Aritmetique Lineaire, 1789
-
A Map of France with the Proposed Divisions. 1793
-
Chart of Universal Commercial History, 1805
-
Chart Shewing the Value of the Quarter of Wheat in Shillings & in Days Wages of a Good Mechanic from 1565 to 1821, 1821
-
Barchart, 1822.
-
Linear Chronology, Exhibiting the Revenues, Expenditure, Debt, Price of Stocks & Bread, from 1770 to 1824, 1824


