Uploads by Pedro Pinto Correia
Jump to navigation
Jump to search
For Pedro Pinto Correia (talk · contributions · Move log · block log · uploads · Abuse filter log)
This special page shows all uploaded files that have not been deleted; for those see the upload log.
| Date | Name | Thumbnail | Size | Description |
|---|---|---|---|---|
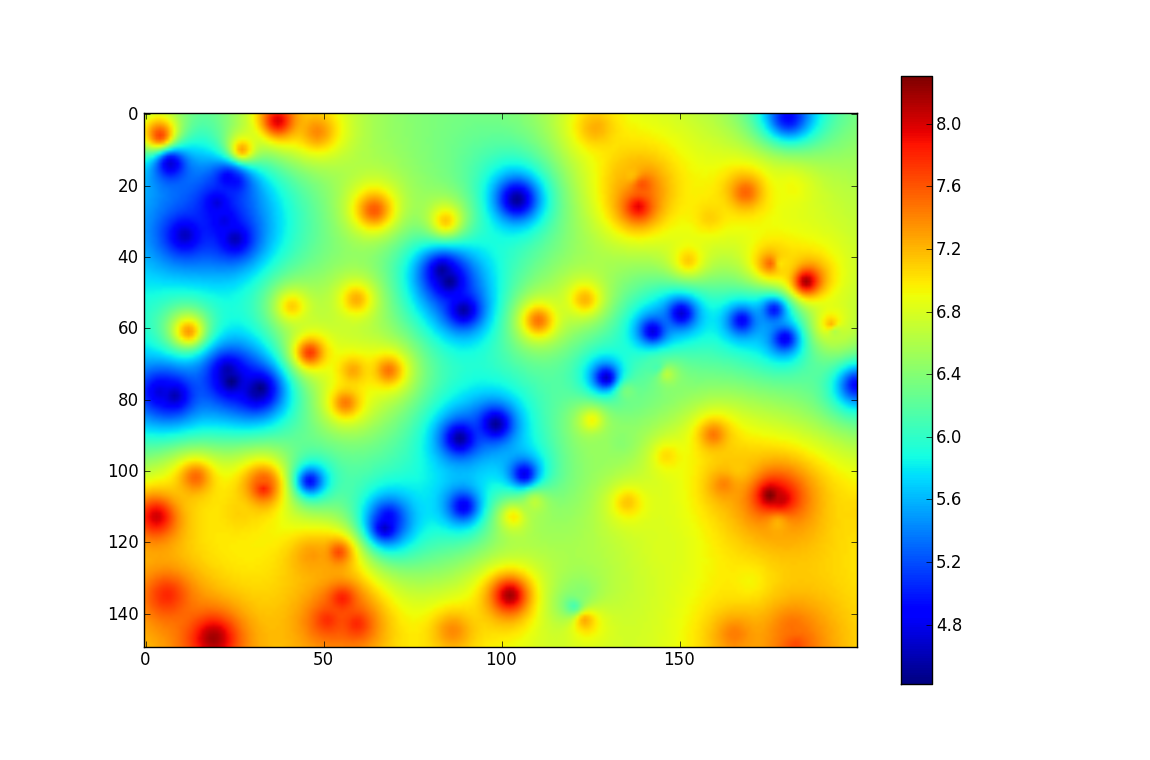
| 14:35, 4 July 2012 | Ordinary kriging 80 50.png (file) |  |
151 KB | |
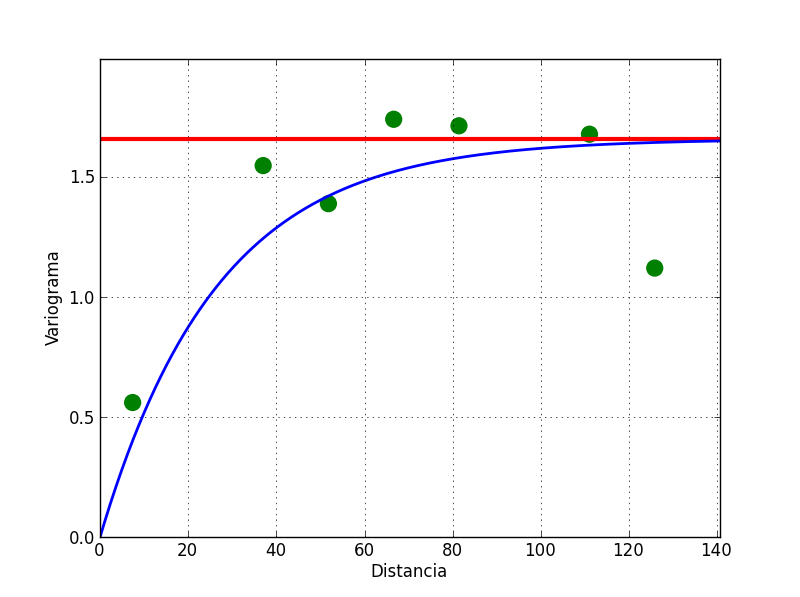
| 22:14, 7 June 2012 | Variograma90.png (file) |  |
26 KB | |
| 22:14, 7 June 2012 | Variograma0.png (file) |  |
31 KB | |
| 22:14, 7 June 2012 | Simple kriging 140 70.png (file) |  |
157 KB | |
| 22:14, 7 June 2012 | Simple kriging 80 50.png (file) |  |
151 KB | |
| 22:14, 7 June 2012 | Simple kriging 50 80.png (file) |  |
156 KB | |
| 22:14, 7 June 2012 | Simple kriging 120 70.png (file) |  |
154 KB | |
| 17:58, 5 June 2012 | HIST NEAREST.png (file) |  |
26 KB | |
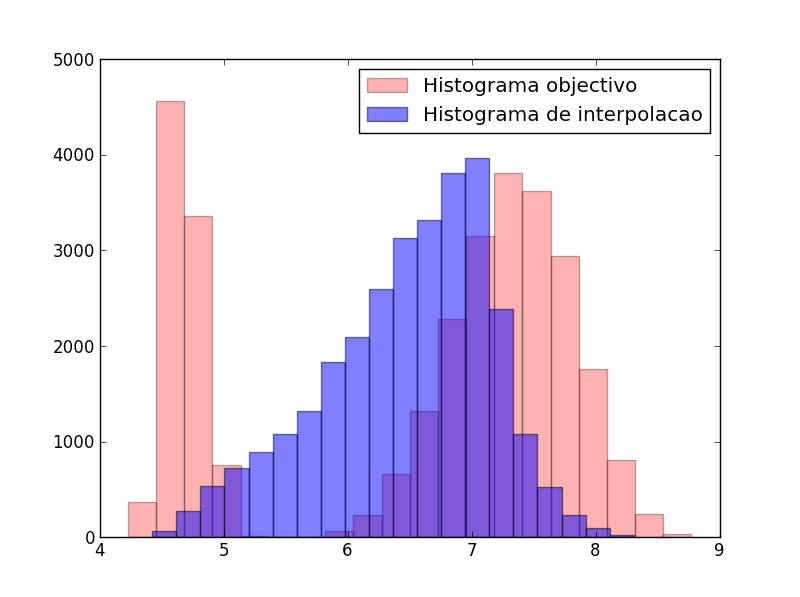
| 17:04, 5 June 2012 | HIST objectivo vs dados.png (file) |  |
23 KB | |
| 17:04, 5 June 2012 | HIST IWD 5.png (file) |  |
26 KB | |
| 17:04, 5 June 2012 | HIST IWD 4.png (file) |  |
26 KB | |
| 17:04, 5 June 2012 | HIST IWD 3.png (file) |  |
26 KB | |
| 17:04, 5 June 2012 | HIST IWD 2.png (file) |  |
26 KB | |
| 17:04, 5 June 2012 | HIST IWD 1.png (file) |  |
30 KB | |
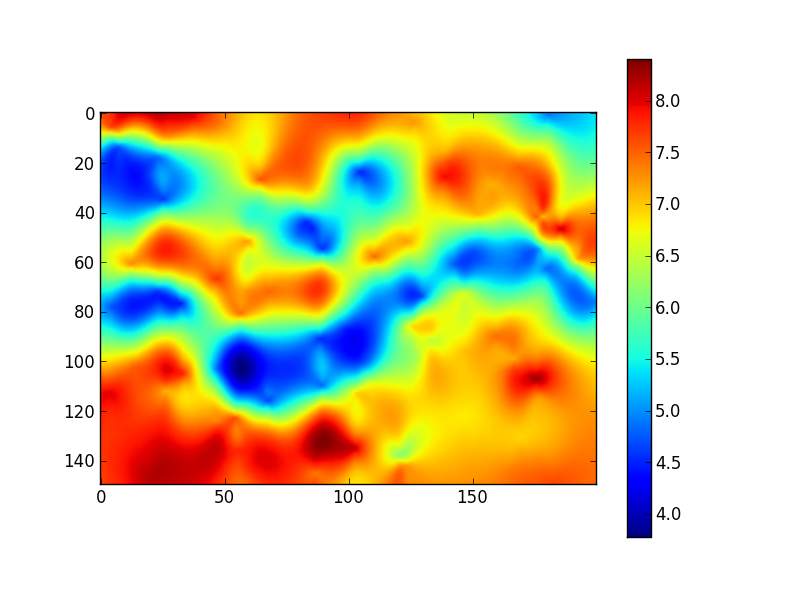
| 15:02, 5 June 2012 | Objective image - Channel reservoir.png (file) |  |
654 KB | |
| 18:11, 4 June 2012 | Nearest neighbour.png (file) |  |
110 KB | |
| 18:11, 4 June 2012 | Sparse data.png (file) |  |
64 KB | |
| 18:11, 4 June 2012 | IWD 5.png (file) |  |
257 KB | |
| 18:11, 4 June 2012 | IWD 6.png (file) |  |
257 KB | |
| 18:11, 4 June 2012 | IWD 4.png (file) |  |
260 KB | |
| 18:11, 4 June 2012 | IWD 3.png (file) |  |
261 KB | |
| 18:11, 4 June 2012 | IWD 2.png (file) |  |
257 KB | |
| 18:11, 4 June 2012 | IWD 1.png (file) |  |
186 KB | |
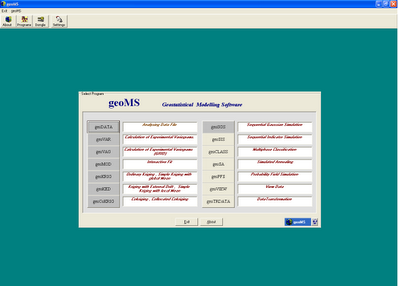
| 18:51, 2 March 2012 | Geoms.PNG (file) |  |
40 KB | |
| 18:38, 27 February 2012 | Explicação acerca do método da simulação sequencial directa.png (file) |  |
72 KB | |
| 17:47, 21 February 2012 | Sgs demonstration.png (file) |  |
143 KB | |
| 22:13, 17 December 2011 | Variograma e covariancia.png (file) |  |
26 KB | |
| 19:12, 16 December 2011 | Variograma covariancia correlograma temperatura na europa.png (file) |  |
31 KB | |
| 21:35, 15 December 2011 | Nuvem de variograma.png (file) |  |
324 KB | |
| 19:41, 14 December 2011 | Modelos ajustados a variograma.png (file) |  |
88 KB | |
| 23:58, 13 December 2011 | Variograma experimental considerando classes.png (file) |  |
50 KB | Este ficheiro foi actualizado para um que explique melhor o processo pretendido. This file was updated to new figure which explains better the intended proccess. |
| 23:02, 13 December 2011 | Variograma experimental com patamar.png (file) |  |
44 KB | |
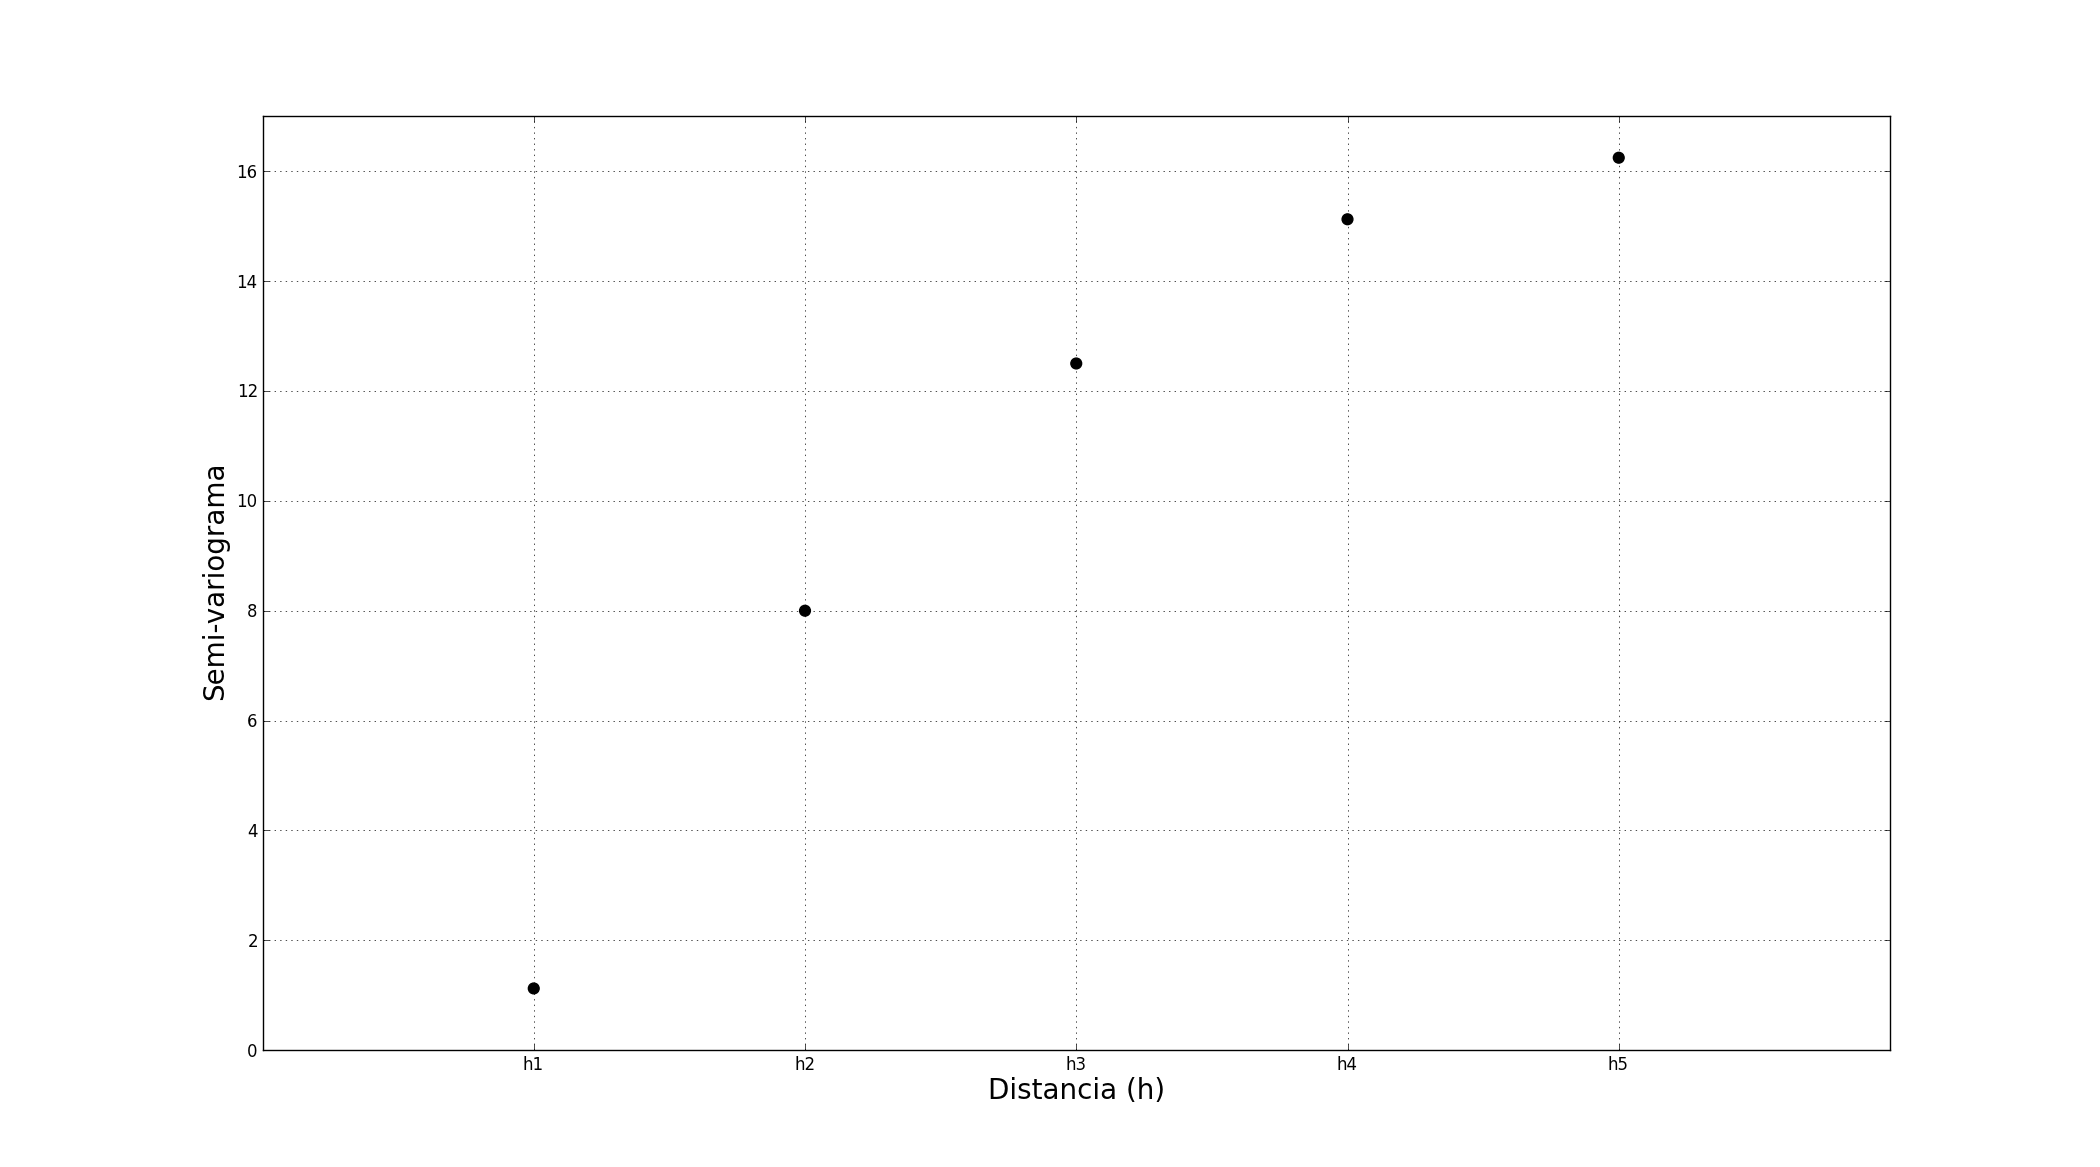
| 22:45, 13 December 2011 | Variograma experimental.png (file) |  |
43 KB | {{Information |Description ={{pt|1=Exemplo de variograma experimental onde uma dada população Z foi re-amostrada para 5 distâncias diferentes (h, eixo x) e calculado o valor de semi-variograma para cada uma das distâncias (eixo y). O resultado é a |