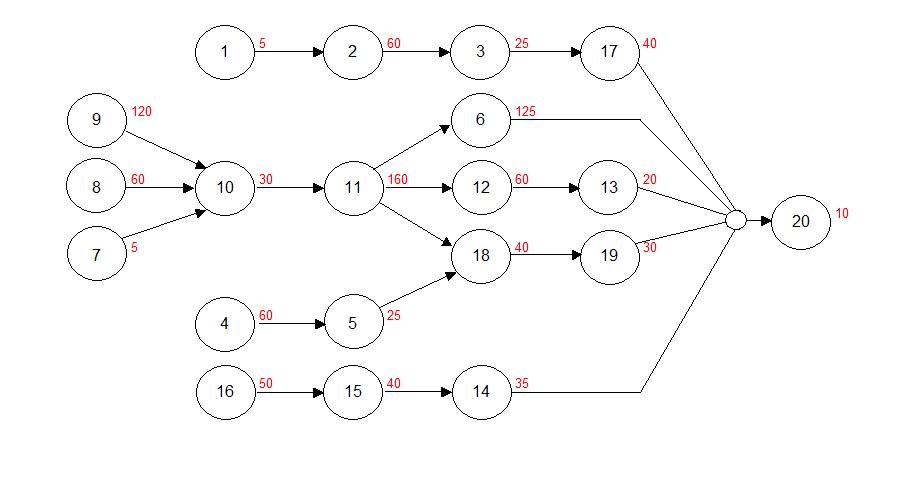
Precedence Diagram
Jump to navigation
Jump to search
The Diagram uses the procedures on page 6 of the handout labeled 1 - 20 as we did in the tutorial. The red number at the top right of the process represents the time in seconds for the process to be completed. The green number at the bottom right represents the weight. I am not 100% sure with this diagram so please check it yourself and let me know if there is something wrong with it.
