File:Simple set2.png
From Wikimedia Commons, the free media repository
Jump to navigation
Jump to search

Size of this preview: 749 × 599 pixels. Other resolutions: 300 × 240 pixels | 600 × 480 pixels | 960 × 768 pixels | 1,267 × 1,014 pixels.
Original file (1,267 × 1,014 pixels, file size: 6 KB, MIME type: image/png)
File information
Structured data
Captions
Captions
Add a one-line explanation of what this file represents
Summary
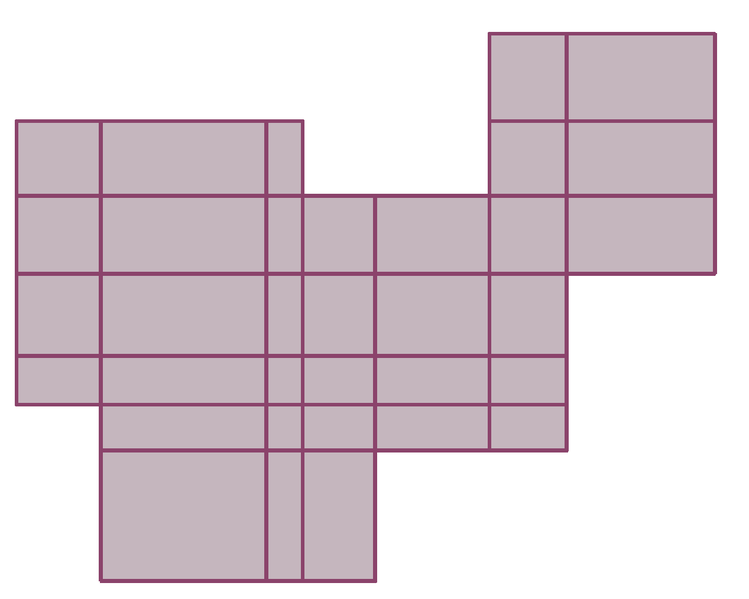
[edit]| DescriptionSimple set2.png | Made by myself with matlab. |
| Date | 7 February 2007 (original upload date) |
| Source | Own work |
| Author | Oleg Alexandrov |
Licensing
[edit]| Public domainPublic domainfalsefalse |
| I, the copyright holder of this work, release this work into the public domain. This applies worldwide. In some countries this may not be legally possible; if so: I grant anyone the right to use this work for any purpose, without any conditions, unless such conditions are required by law. |
% split a union of rectangles into a union of rectangles without overlaps
function main()

   M=10; imag_root=sqrt(-1); lw=2.5; Ball_rad=0.03;

   figure(2); clf; hold on; axis equal; axis off;

% plot the outer polygonal curve
   color = [139;10;80]/256;

   X=[-2.3677    1.7624    0.1177    4.6499   -3.6469    0.6659    3.4803    6.8794];
   Y=[-3.1177    0.2814   -1.1440    2.6937     -0.4496  3.8268    1.5241    5.1425];

%  a dummy plot to avoid a matlab bug causing some lines to appear too thin
   C=1.05;
   plot(C*min(X), C*min(Y), '*', 'color', 0.99*[1, 1, 1]);
   plot(C*max(X), C*max(Y), '*', 'color', 0.99*[1, 1, 1]);

   % plot the big rectangles, and fill their interiors
   n=length(X)/2;
   for i=1:n
      ax=X(2*i-1); bx=X(2*i);
      ay=Y(2*i-1); by=Y(2*i);

      % plot the rectangle
      plot([ax bx bx ax ax], [ay ay by by ay], 'linewidth', lw, 'color', color);

      % round off the corners (a cosmetic thing)
      round_ball(ax+imag_root*ay, Ball_rad, color');
      round_ball(ax+imag_root*by, Ball_rad, color');
      round_ball(bx+imag_root*ay, Ball_rad, color');
      round_ball(bx+imag_root*by, Ball_rad, color');

   end

% plot the interiors all the small rectangles
   XS=sort(X); YS = sort (Y);

   for l=1:(length(XS)-1);
      for m=1:(length(YS)-1)
	 cx=XS(l); dx=XS(l+1);
	 cy=YS(m); dy=YS(m+1);

	 success=0; % don't fill a rectangle more than once (will show up darker then)
	 for i=1:n
	    ax=X(2*i-1); bx=X(2*i);
	    ay=Y(2*i-1); by=Y(2*i);
	    if ax <= cx & dx <= bx & ay <= cy & dy <= by & success ==0
	       success=1;
	       fill([cx dx dx cx], [cy cy dy dy], color'/2, 'FaceAlpha', 0.3, 'linewidth', 0.01, 'EdgeAlpha', 0);
	    end

	    end
      end
   end

% plot the edges of all rectanges
   for i=1:n
      ax=X(2*i-1); bx=X(2*i);
      ay=Y(2*i-1); by=Y(2*i);

      for l=1:length(XS);
	 u=XS(l);
	 if ax < u & u < bx
	    plot([u u], [ay, by], 'linewidth', lw, 'color', color);
	 end


      end

      for l=1:length(YS);
	 v=YS(l);
	 if ay < v & v < by
	    plot([ax bx], [v, v], 'linewidth', lw, 'color', color);
	 end


      end
   end


   saveas(gcf, 'simple_set2.eps', 'psc2');

function round_ball(z, r, color)
   x=real(z); y=imag(z);
   Theta = 0:0.1:2*pi;
   X = r*cos(Theta)+x;
   Y = r*sin(Theta)+y;
   Handle = fill(X, Y, color);
   set(Handle, 'EdgeColor', color);

|
This math image could be re-created using vector graphics as an SVG file. This has several advantages; see Commons:Media for cleanup for more information. If an SVG form of this image is available, please upload it and afterwards replace this template with
{{vector version available|new image name}}.
It is recommended to name the SVG file “Simple set2.svg”—then the template Vector version available (or Vva) does not need the new image name parameter. |
File history
Click on a date/time to view the file as it appeared at that time.
| Date/Time | Thumbnail | Dimensions | User | Comment | |
|---|---|---|---|---|---|
| current | 04:01, 7 February 2007 |  | 1,267 × 1,014 (6 KB) | Oleg Alexandrov (talk | contribs) | Made by myself with matlab. |
You cannot overwrite this file.
File usage on Commons
There are no pages that use this file.
File usage on other wikis
The following other wikis use this file:
- Usage on de.wikibooks.org
- Usage on de.wikiversity.org
- Produktraum/Endlich/Produktpräring/Produktprämaß/Textabschnitt
- Kurs:Mathematik (Osnabrück 2009-2011)/Teil III/Vorlesung 66
- Kurs:Mathematik (Osnabrück 2009-2011)/Teil III/Vorlesung 66/kontrolle
- Kurs:Analysis (Osnabrück 2013-2015)/Teil III/Vorlesung 65
- Kurs:Analysis (Osnabrück 2014-2016)/Teil III/Vorlesung 65
- Kurs:Analysis (Osnabrück 2014-2016)/Teil III/Vorlesung 65/kontrolle
- Kurs:Maß- und Integrationstheorie (Osnabrück 2022-2023)/Vorlesung 5
- Kurs:Maß- und Integrationstheorie (Osnabrück 2022-2023)/Vorlesung 5/kontrolle
- Kurs:Analysis (Osnabrück 2013-2015)/Teil III/Vorlesung 65/kontrolle
- Usage on en.wikipedia.org
- Usage on fr.wikipedia.org
- Usage on it.wikipedia.org
- Usage on ja.wikipedia.org
- Usage on ko.wikipedia.org
- Usage on pl.wikipedia.org
- Usage on sv.wikipedia.org
- Usage on zh.wikipedia.org