Category:Images with Matlab source code
Jump to navigation
Jump to search
Media in category "Images with Matlab source code"
The following 198 files are in this category, out of 198 total.
-
16Mcolors.png 4,096 × 4,096; 55 KB
-
Amoeba of p=w-2z-1.png 1,479 × 1,483; 24 KB
-
Amoeba2.png 1,504 × 1,446; 13 KB
-
Amoeba2.svg 940 × 904; 1 KB
-
Amoeba3.png 1,267 × 1,006; 12 KB
-
Amoeba4 400.png 1,896 × 1,917; 263 KB
-
Ampersandcurve.png 844 × 1,061; 43 KB
-
Analytic continuation along a curve.png 408 × 1,006; 32 KB
-
Argument principle1.png 200 × 168; 7 KB
-
Bernoulli inequality.png 556 × 1,056; 28 KB
-
BicubicInterpolationExample.png 1,976 × 1,540; 65 KB
-
Biholomorphism illustration.svg 4,709 × 8,557; 43 KB
-
BilinearInterpolExample.png 1,980 × 1,536; 57 KB
-
Bilininterp.png 1,002 × 801; 27 KB
-
Black and white wiggler.gif 500 × 500; 2.85 MB
-
Carotid Fractal.png 800 × 702; 24 KB
-
Cauchy sequence illustration.png 2,706 × 1,894; 76 KB
-
Circle as convex metric space.png 1,103 × 1,081; 23 KB
-
Circle charts.png 400 × 376; 19 KB
-
Complex numbers addition.png 468 × 473; 16 KB
-
Conformal map.svg 535 × 937; 34 KB
-
Conjugate gradient illustration.svg 804 × 1,212; 2 KB
-
Contour.png 640 × 457; 36 KB
-
Convex outcome set of a multi-objective optimization problem.gif 360 × 392; 906 KB
-
Convolution of box signal with itself.gif 474 × 145; 77 KB
-
Convolution of box signal with itself2.gif 468 × 147; 83 KB
-
Convolution of spiky function with box.gif 475 × 144; 106 KB
-
Convolution of spiky function with box2.gif 468 × 135; 76 KB
-
Damped spring.gif 110 × 359; 207 KB
-
Data Fusion - Scatter plot.png 719 × 651; 22 KB
-
Dirac function approximation.gif 200 × 335; 89 KB
-
Discontinuity essential.eps.png 2,506 × 1,700; 83 KB
-
Discontinuity jump.eps.png 2,122 × 1,978; 81 KB
-
Discontinuity removable.eps.png 2,506 × 1,844; 72 KB
-
Discrete probability distribution illustration.png 1,806 × 2,033; 44 KB
-
Double torus illustration.png 985 × 1,077; 260 KB
-
DragonCurve animation.gif 641 × 480; 143 KB
-
Drini-conjugatehyperbolas.svg 512 × 512; 2 KB
-
Drum vibration mode01.gif 249 × 161; 200 KB
-
Drum vibration mode02.gif 252 × 169; 200 KB
-
Drum vibration mode11.gif 248 × 130; 214 KB
-
Drum vibration mode12.gif 249 × 170; 148 KB
-
Drum vibration mode13.gif 250 × 130; 137 KB
-
Drum vibration mode21.gif 248 × 130; 230 KB
-
Drum vibration mode22.gif 248 × 130; 239 KB
-
Drum vibration mode23.gif 250 × 130; 245 KB
-
Empirical CDF.png 400 × 320; 6 KB
-
Exp series.gif 292 × 392; 51 KB
-
Extreme points illustration.png 427 × 396; 10 KB
-
Finite element method 1D illustration1.png 1,002 × 651; 42 KB
-
Finite element method 1D illustration2.png 1,002 × 651; 55 KB
-
Finite element triangulation.svg 815 × 815; 207 KB
-
Five point stencil illustration.png 2,192 × 2,408; 106 KB
-
Fractal fern-Barnsley animation.gif 828 × 573; 84 KB
-
Gauss Newton illustration.png 1,532 × 1,236; 53 KB
-
Gaussian 2d.png 1,014 × 774; 62 KB
-
Gaussian 3D - brown.png 761 × 848; 42 KB
-
Gold Spider SEM sample Sharp.jpg 538 × 870; 96 KB
-
Golden Mean Quadratic Siegel Disc Speed.png 1,000 × 1,000; 279 KB
-
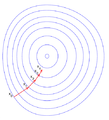
Gradient descent.png 482 × 529; 25 KB
-
Gradient descent.svg 512 × 549; 56 KB
-
Heat eqn.gif 200 × 136; 500 KB
-
Helmholtz solution.png 975 × 1,957; 23 KB
-
Heronian trig.png 212 × 144; 2 KB
-
Homotopy with fixed endpoints.png 944 × 1,078; 39 KB
-
Image coherent noise example.png 512 × 512; 5 KB
-
Image gaussian noise example.png 512 × 512; 231 KB
-
Image salt pepper noise example.png 512 × 512; 30 KB
-
Image shot noise example.png 512 × 512; 161 KB
-
Indicator function illustration.png 813 × 516; 19 KB
-
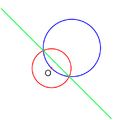
Inversion illustration2.png 503 × 503; 19 KB
-
Inversion illustration3.png 503 × 503; 26 KB
-
Ironattenuation.PNG 1,400 × 950; 80 KB
-
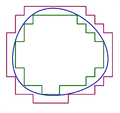
Jordan illustration.png 1,064 × 1,006; 55 KB
-
Kampyle Eudoxus.png 622 × 1,092; 13 KB
-
KochCube Animation Gray.gif 1,201 × 901; 448 KB
-
Laplaces method.png 406 × 1,036; 23 KB
-
Lens and wavefronts.gif 183 × 356; 35 KB
-
Level grad.png 358 × 336; 70 KB
-
Level grad.svg 512 × 512; 249 KB
-
Level set method.jpg 800 × 600; 89 KB
-
LimSup.png 996 × 509; 46 KB
-
Linear least squares example.png 428 × 526; 12 KB
-
Linear least squares example2.png 1,245 × 1,569; 52 KB
-
Linear least squares2.png 889 × 1,067; 30 KB
-
Mathbot.svg 187 × 257; 11 KB
-
Matlab Logo.png 2,529 × 2,264; 508 KB
-
Matlab Plot of a Cruller.png 701 × 558; 42 KB
-
MATLAB surf sinc3D.svg 512 × 384; 1.31 MB
-
MATLABCChart.png 560 × 420; 4 KB
-
MATLABEWMAChart.png 560 × 420; 4 KB
-
MATLABIndividualsChartForPairedIndividualsAndMRChart.png 560 × 420; 4 KB
-
MATLABMovingAverageChart.png 561 × 420; 4 KB
-
MATLABMRChartForPairedIndividualsAndMRChart.png 560 × 420; 4 KB
-
MATLABNPChart.png 561 × 420; 4 KB
-
MATLABPChart.png 560 × 420; 4 KB
-
MATLABRChartForPairedXBarAndRChart.png 560 × 420; 4 KB
-
MATLABSChartForPairedXBarAndSChart.png 560 × 420; 4 KB
-
MATLABUChart.png 560 × 420; 4 KB
-
MATLABXBarChartForPairedXBarAndRChart.png 560 × 420; 4 KB
-
MATLABXBarChartForPairedXBarAndSChart.png 561 × 420; 4 KB
-
Maximum modulus principle.png 675 × 711; 30 KB
-
Mesh.png 640 × 457; 321 KB
-
Midpoint method illustration.png 1,863 × 1,667; 65 KB
-
ML expansion illustration.png 1,621 × 1,508; 77 KB
-
ML-star.png 1,621 × 1,508; 129 KB
-
Mollifier illustration.png 500 × 158; 6 KB
-
Mollifier movie.gif 624 × 387; 372 KB
-
MonteCarloIntegrationCircle.png 360 × 360; 5 KB
-
Nanoribbon Conductance.PNG 3,389 × 2,380; 50 KB
-
Newton iteration.png 2,406 × 1,978; 55 KB
-
Newton optimization vs grad descent.svg 813 × 936; 48 KB
-
Non-analytic smooth function.png 376 × 124; 5 KB
-
NonConvex.gif 360 × 392; 782 KB
-
Normal and tangent illustration.png 1,314 × 1,272; 57 KB
-
Numerical integration illustration, h=0.25.png 1,500 × 2,183; 85 KB
-
Numerical integration illustration, h=1.png 1,500 × 2,183; 72 KB
-
Parabolic trajectory.svg 512 × 212; 8 KB
-
Partial transmittance.gif 367 × 161; 67 KB
-
Partition of unity illustration.svg 5,400 × 891; 12 KB
-
Parzen window illustration.png 635 × 103; 13 KB
-
Parzen window illustration.svg 620 × 88; 26 KB
-
Pedal line illustration.png 427 × 453; 39 KB
-
Pedal trig illustration.png 570 × 447; 17 KB
-
PeriodicVoronoiTessellation.png 2,048 × 2,048; 152 KB
-
Phase vs Time, wrapped and unwrapped.jpg 757 × 390; 129 KB
-
Phase-shift illustration.png 485 × 485; 5 KB
-
Photon Cross Sections.png 1,280 × 929; 55 KB
-
Photon Mass Attenuation Coefficients.png 1,280 × 908; 55 KB
-
Photon Mean Free Path.png 1,097 × 855; 36 KB
-
Piecewise linear function2D.svg 443 × 443; 60 KB
-
Plane wave.gif 145 × 356; 34 KB
-
Plane wave.png 486 × 981; 4 KB
-
Plot2.png 640 × 463; 7 KB
-
Polar.png 640 × 457; 56 KB
-
Quasiconvex function.png 501 × 358; 11 KB
-
Random walk in2D closeup.png 842 × 989; 29 KB
-
Random walk in2D.png 661 × 989; 40 KB
-
Right concoid.svg 560 × 600; 2.28 MB
-
Rosenbrock function.svg 720 × 540; 2.28 MB
-
Rotating black and white squares.gif 500 × 500; 2.52 MB
-
Rotation illustration.png 936 × 989; 19 KB
-
Rotation illustration2.svg 1,005 × 897; 12 KB
-
Scalloping and noise floor comparisons (2 window functions).png 562 × 457; 22 KB
-
Scattering theory illust.png 480 × 1,988; 49 KB
-
Schwarz-Christoffel transformation.png 580 × 177; 7 KB
-
Second order system response to step input.png 560 × 420; 11 KB
-
Serpentine curve.png 2,054 × 371; 8 KB
-
Signed distance1.png 1,025 × 1,903; 31 KB
-
Signed distance2.png 1,025 × 1,856; 38 KB
-
Simple set1.png 1,267 × 1,014; 6 KB
-
Simple set2.png 1,267 × 1,014; 6 KB
-
Snells law wavefronts.gif 225 × 227; 65 KB
-
Snells law wavefronts.png 360 × 314; 62 KB
-
Snells law wavefronts.svg 410 × 342; 68 KB
-
Spectral leakage from a sinusoid and rectangular window.png 508 × 412; 47 KB
-
Sphere with three handles.png 1,308 × 1,004; 389 KB
-
Spherical mean.png 526 × 631; 38 KB
-
Spherical wave2.gif 178 × 178; 117 KB
-
Spring beforeresonance.gif 435 × 290; 230 KB
-
Spring pastresonance.gif 435 × 340; 344 KB
-
Spring resonance simple.gif 334 × 343; 279 KB
-
Spring resonance.gif 338 × 343; 308 KB
-
Standard deviation.svg 512 × 411; 12 KB
-
Stehende Welle.gif 640 × 480; 910 KB
-
SunflowerModel.svg 512 × 512; 147 KB
-
Superposition of circles.png 2,000 × 2,000; 1.05 MB
-
Surface normal illustration.png 1,379 × 1,488; 24 KB
-
Surface of revolution illustration.png 693 × 885; 130 KB
-
Surface vectors.png 1,455 × 807; 80 KB
-
Swastica curve3.png 587 × 579; 19 KB
-
Syntractrix a=0.5 b=1.png 2,025 × 554; 21 KB
-
Syntractrix a=1.5 b=1.png 2,025 × 554; 25 KB
-
TonnetzTorus.gif 900 × 490; 3.21 MB
-
Torus illustration.png 900 × 594; 147 KB
-
Total variation.gif 179 × 236; 57 KB
-
Trace operator illustration.png 660 × 1,842; 43 KB
-
Triple torus array.png 1,123 × 990; 250 KB
-
Triple torus illustration.png 2,204 × 1,550; 670 KB
-
Tschirnhausen cubic.png 1,100 × 1,638; 63 KB
-
Tubular neighborhood.png 2,506 × 1,967; 374 KB
-
Tubular neighborhood3.png 928 × 1,289; 24 KB
-
TV pic1.png 825 × 989; 18 KB
-
TV pic2.png 886 × 989; 19 KB
-
TV pic3.png 786 × 644; 11 KB
-
Two dim standing wave.gif 200 × 140; 142 KB
-
Two sources interference.gif 200 × 200; 162 KB
-
Ueberlagerung gegenlaeufiger Wellen -01.gif 435 × 343; 313 KB
-
Volume under surface.png 636 × 762; 56 KB
-
Wave equation 1D fixed endpoints.gif 274 × 121; 129 KB
-
Wave packet.svg 5,478 × 3,964; 29 KB
-
Window function (gauss).svg 883 × 346; 484 KB
-
Window function (hamming).svg 907 × 346; 455 KB
-
Window function (hann).svg 906 × 346; 477 KB
-
Window function (Kaiser; alpha = 2 pi).png 1,761 × 597; 81 KB
-
Window function (Kaiser; alpha = 3 pi).png 1,785 × 607; 84 KB
-
Window function (rectangular).svg 901 × 346; 472 KB


