File:Mapping-molecules-in-scanning-far-field-fluorescence-nanoscopy-ncomms8977-s2.ogv
Jump to navigation
Jump to search
Size of this JPG preview of this OGG file: 800 × 420 pixels. Other resolutions: 320 × 168 pixels | 640 × 336 pixels | 1,024 × 538 pixels | 1,600 × 840 pixels.
Original file (Ogg Theora video file, length 36 s, 1,600 × 840 pixels, 1.96 Mbps, file size: 8.33 MB)
Captions
Captions
Add a one-line explanation of what this file represents
Summary
[edit]| Description |
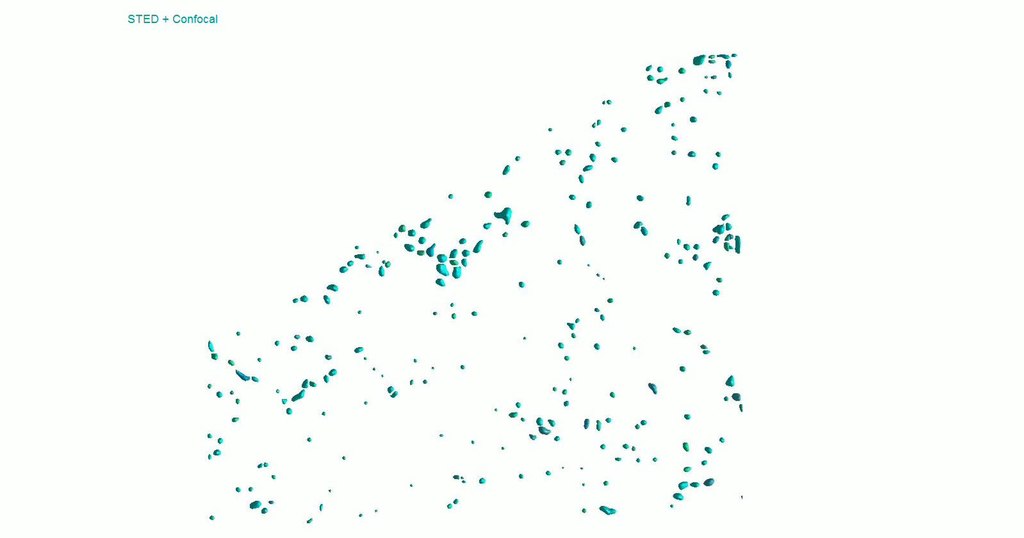
English: Supplementary Movie 1 A 3D molecular map of the TfR (stained with aptamer in HEK293 cells) is reconstructed from the photon statistics of confocal and STED measurements. Isosurfaces of the molecular map which embrace 70% of the overall number of molecules in the corresponding cluster are plotted in the animation. The cluster segmentation is performed with the built in watershed function in MATLAB. 0 - 5 s: reconstruction from the photon statistics of confocal recording (Red). 6 - 11 s: reconstruction from the photon statistics of confocal and STED recording (Cyan). 19 - 31 s: reconstruction from the photon statistics of confocal and STED recording with color code representing the number of molecules in each cluster. The full region is 8 x 8 x 2 μm. |
||
| Date | |||
| Source | Video file from Ta H, Keller J, Haltmeier M, Saka S, Schmied J, Opazo F, Tinnefeld P, Munk A, Hell S (2015). "Mapping molecules in scanning far-field fluorescence nanoscopy". Nature Communications. DOI:10.1038/ncomms8977. PMID 26269133. PMC: 4557268. | ||
| Author | Ta H, Keller J, Haltmeier M, Saka S, Schmied J, Opazo F, Tinnefeld P, Munk A, Hell S | ||
| Permission (Reusing this file) |
This file is licensed under the Creative Commons Attribution 4.0 International license.
|
||
| Provenance |
|
File history
Click on a date/time to view the file as it appeared at that time.
| Date/Time | Thumbnail | Dimensions | User | Comment | |
|---|---|---|---|---|---|
| current | 09:31, 31 October 2016 | 36 s, 1,600 × 840 (8.33 MB) | Open Access Media Importer Bot (talk | contribs) | Automatically uploaded media file from Open Access source. Please report problems or suggestions here. |
You cannot overwrite this file.
File usage on Commons
There are no pages that use this file.