File:Instrumental Temperature Record by R Rhode.svg
Jump to navigation
Jump to search

Size of this PNG preview of this SVG file: 800 × 590 pixels. Other resolutions: 320 × 236 pixels | 640 × 472 pixels | 1,024 × 756 pixels | 1,280 × 944 pixels | 2,560 × 1,889 pixels | 801 × 591 pixels.
Original file (SVG file, nominally 801 × 591 pixels, file size: 126 KB)
Captions
Captions
Add a one-line explanation of what this file represents
Summary
[edit]
| Description |
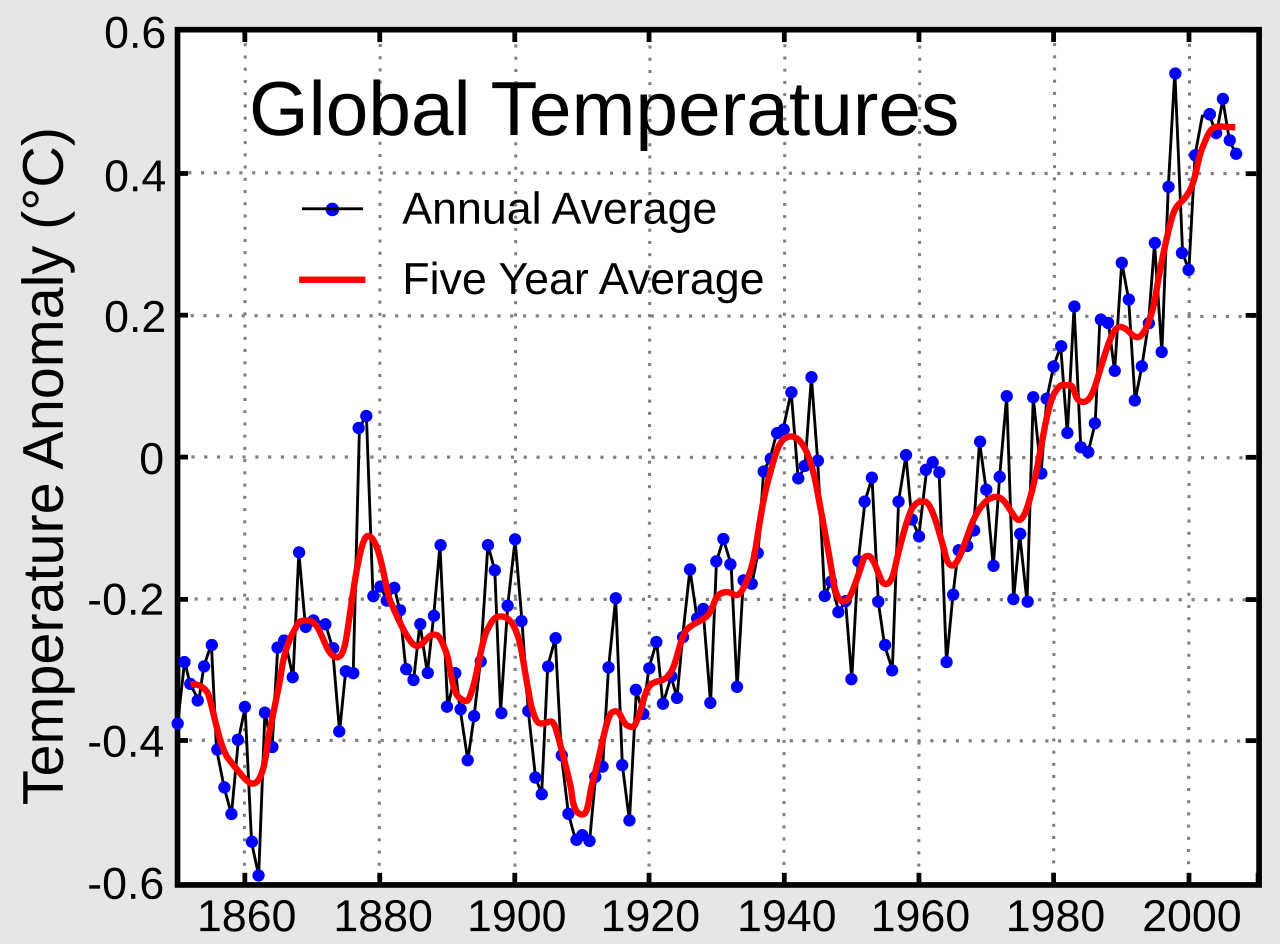
English: This image shows the instrumental record of global average temperatures as compiled by the Climatic Research Unit of the University of East Anglia and the Hadley Centre of the UK Meteorological Office. Data set HadCRUT3 was used. HadCRUT3 is a record of surface temperatures collected from land and ocean-based stations. The most recent documentation for this data set is Following the common practice of the IPCC, the zero on this figure is the mean temperature from 1961-1990.
This figure is an SVG copy of an original prepared by Robert A. Rohde from publicly available data. The original figure is part of the Global Warming Art project. |
| Date | 25 June 2008 (original upload date) |
| Source | Transferred from en.wikipedia to Commons by IngerAlHaosului using CommonsHelper. |
| Author | The original uploader was Leland McInnes at English Wikipedia. |
| SVG development | This plot was created with Matplotlib. |
| Source code | Python code#!/usr/bin/env python
# -*- coding: utf-8 -*-
import matplotlib.pylab as plt
import urllib
import matplotlib
# Download latest data directly from NASA, and process
temp_file = urllib.urlopen("http://data.giss.nasa.gov/gistemp/graphs/Fig.A2.txt")
data_rows = [x.split() for x in temp_file if x.startswith(" 1") or x.startswith(" 2")]
years = [int(x[0]) for x in data_rows if x[1] != "*"]
temps = [float(x[1]) for x in data_rows if x[1] != "*"]
moving_av_temps = [float(x[2]) for x in data_rows if x[2] != "*"]
moving_av_years = [int(x[0]) for x in data_rows if x[2] != "*"]
# Set some parameters to ensure suitable output
matplotlib.rcParams['backend'] = "Cairo"
matplotlib.rcParams['font.sans-serif'] = ["Arial"]
matplotlib.rcParams['xtick.labelsize'] = 20
matplotlib.rcParams['ytick.labelsize'] = 20
matplotlib.rcParams['svg.embed_char_paths'] = True
ax = plt.axes([0.125,0.05,0.835,0.92])
plt.grid(color="#cccccc", linestyle=":", lw=2, zorder=1)
plt.plot(years, temps, "k-", lw=1.2, marker="o", markerfacecolor="blue", zorder=3, solid_joinstyle="round", label="Annual average")
plt.plot(moving_av_years, moving_av_temps, "r-", lw=3.5, zorder=4, label="Five Year Average")
plt.ylabel(u"Temperature anomaly (°C)", size=24)
plt.text(1884,0.55,"Global Temperatures",ha="left", va="center",size=38)
plt.legend(loc=(0.04,0.68), prop=matplotlib.font_manager.FontProperties(size=24))
plt.xlim(1880,2015)
plt.ylim(-0.45,0.65)
plt.savefig("instrumental-temperature-record.svg", facecolor="#e0e0e0")
plt.show()
|
Licensing
[edit]
Image from Global Warming Art
This image is an original work created for Global Warming Art. Please refer to the image description page for more information.

|
Permission is granted to copy, distribute and/or modify this document under the terms of the GNU Free Documentation License, Version 1.2 or any later version published by the Free Software Foundation; with no Invariant Sections, no Front-Cover Texts, and no Back-Cover Texts. A copy of the license is included in the section entitled GNU Free Documentation License. |
| This file is licensed under the Creative Commons Attribution-Share Alike 3.0 Unported license. | ||
| ||
| This licensing tag was added to this file as part of the GFDL licensing update. |
| Dragons flight's Temperature Record Series |
| This figure is part of a series of plots created by Dragons flight to illustrate changes in Earth's temperature and climate across many different time scales. |
| Time Period: 25 yrs | 150 yrs | 1 kyr | 2 kyr | 12 kyr | 450 kyr | 5 Myr | 65 Myr | 500 Myr |
| For articles related to this topic see: Temperature record |
Original upload log
[edit]
The original description page was here. All following user names refer to en.wikipedia.
- 2008-06-25 01:36 Leland McInnes 801×591× (129310 bytes)
- 2008-06-25 00:13 Leland McInnes 801×593× (129750 bytes)
- 2008-06-24 23:38 Leland McInnes 801×593× (129747 bytes) This image shows the instrumental record of global average temperatures as compiled by the [[Climatic Research Unit]] of the [[University of East Anglia]] and the [[Hadley Centre]] of the [[Met Office|UK Meteorological Office]]. [http://hadobs.metoffice.
File history
Click on a date/time to view the file as it appeared at that time.
| Date/Time | Thumbnail | Dimensions | User | Comment | |
|---|---|---|---|---|---|
| current | 08:21, 7 October 2009 | | 801 × 591 (126 KB) | File Upload Bot (Magnus Manske) (talk | contribs) | {{BotMoveToCommons|en.wikipedia|year={{subst:CURRENTYEAR}}|month={{subst:CURRENTMONTHNAME}}|day={{subst:CURRENTDAY}}}} {{Information |Description={{en|This image shows the instrumental record of global average temperatures as compiled by the [[:en:Climat |
You cannot overwrite this file.
File usage on Commons
There are no pages that use this file.