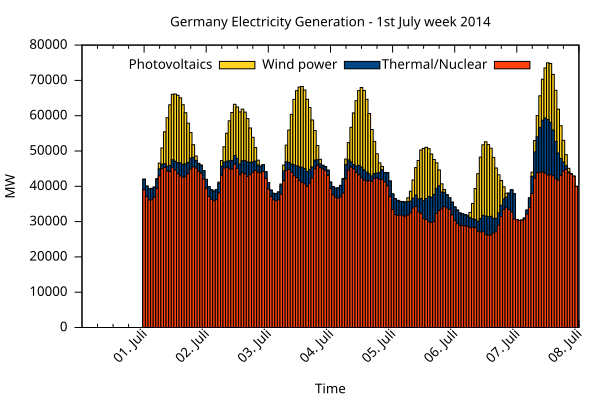
File:German Wind and Solar 2014-07-01 to 2014-07-07.svg
From Wikimedia Commons, the free media repository
Jump to navigation
Jump to search

Size of this PNG preview of this SVG file: 600 × 400 pixels. Other resolutions: 320 × 213 pixels | 640 × 427 pixels | 1,024 × 683 pixels | 1,280 × 853 pixels | 2,560 × 1,707 pixels.
Original file (SVG file, nominally 600 × 400 pixels, file size: 139 KB)
File information
Structured data
Captions
Captions
Add a one-line explanation of what this file represents
| DescriptionGerman Wind and Solar 2014-07-01 to 2014-07-07.svg |
English: Germany wind and solar generation hourly for first week of July 2014. Data source is European Energy Exchange. |
||
| Date | |||
| Source |
Own work, 1. Juliwoche.csv set term svg size 600,400 font "DejaVu,10"
set output 'German Wind and Solar 2014-07-01 to 2014-07-07.svg'
set title 'Germany Electricity Generation - 1st July week 2014'
set datafile separator ";"
set ytics out nomirror
# This won't affect histogram plots since they just treat the
# dates in the first columns as literal strings.
set format x "%m/%d"
# Setting xdata to time precludes the use of histograms.
set xdata time
set timefmt '%Y/%m/%d %H:%M'
set style fill solid border -1
set boxwidth 1 relative
set yrange [0:*]
set ylabel 'MW'
set xlabel 'Time'
# ($2+$3) is an expression meaning 'add the values in column 2 and
# column 3'; this is effectively the same as row-stacking.
# Data-series should be given in order of decreasing magnitude.
plot "1. Juliwoche.csv" u 1:($2+$3+$4) with boxes lc rgb "#ffd320" t "Photovoltaics", \
"" using 1:($2+$3) with boxes lc rgb "#004586" t "Wind power", \
"" using 1:2 with boxes lc rgb "#ff420e" t "Thermal/Nuclear"
|
||
| Author | Kopiersperre (talk) | ||
| Permission (Reusing this file) |
I, the copyright holder of this work, hereby publish it under the following licenses: This file is licensed under the Creative Commons Attribution-Share Alike 3.0 Unported license.
You may select the license of your choice. |
File history
Click on a date/time to view the file as it appeared at that time.
| Date/Time | Thumbnail | Dimensions | User | Comment | |
|---|---|---|---|---|---|
| current | 13:04, 26 August 2014 |  | 600 × 400 (139 KB) | Delphi234 (talk | contribs) | move legend |
| 13:01, 26 August 2014 |  | 600 × 400 (139 KB) | Delphi234 (talk | contribs) | move legend | |
| 19:21, 25 August 2014 |  | 600 × 400 (137 KB) | Kopiersperre (talk | contribs) | x-Achsenbeschriftung | |
| 17:49, 25 August 2014 |  | 600 × 400 (135 KB) | Kopiersperre (talk | contribs) | {{Information |description={{en|1=Germany wind and solar generation hourly for first week of July 2014. Data source is [http://www.transparency.eex.com/en/].}} |Source={{Own}}, {{Created with gnuplot}} <source lang="gnuplot"> set term svg size 600,400... |
You cannot overwrite this file.
File usage on Commons
There are no pages that use this file.
Metadata
This file contains additional information such as Exif metadata which may have been added by the digital camera, scanner, or software program used to create or digitize it. If the file has been modified from its original state, some details such as the timestamp may not fully reflect those of the original file. The timestamp is only as accurate as the clock in the camera, and it may be completely wrong.
| Short title | Gnuplot |
|---|---|
| Image title | Produced by GNUPLOT 4.6 patchlevel 5 |
| Width | 600 |
| Height | 400 |
