Category:Wikipedia reading dwell time analysis
Jump to navigation
Jump to search
Media files related to this research project about reading behavior on Wikipedia.
Media in category "Wikipedia reading dwell time analysis"
The following 65 files are in this category, out of 65 total.
-
Density of English Wikipedia Page Visible Times (Logged).png 980 × 724; 25 KB
-
Dwelling on Wikipedia slides from Opensym 2019.pdf 1,889 × 531, 42 pages; 452 KB
-
Enwiki Exponentiated Weibull Reading Time Goodness Of Fit Chart 2.png 1,198 × 604; 46 KB
-
Enwiki Exponentiated Weibull Reading Time Goodness Of Fit Chart LOGGED.png 742 × 1,000; 95 KB
-
Enwiki Exponentiated Weibull Reading Time Goodness Of Fit Chart.png 1,665 × 855; 90 KB
-
Enwiki LogNormal Reading Time Goodness Of Fit Chart LOGGED.png 742 × 1,000; 93 KB
-
Enwiki LogNormal Reading Time Goodness Of Fit Chart.png 1,198 × 604; 45 KB
-
Enwiki Lomax Reading Time Goodness Of Fit Chart LOGGED.png 742 × 1,000; 88 KB
-
Enwiki Lomax Reading Time Goodness Of Fit Chart.png 1,198 × 604; 47 KB
-
Enwiki Weibull Reading Time Goodness Of Fit Chart LOGGED.png 742 × 1,000; 91 KB
-
Enwiki Weibull Reading Time Goodness Of Fit Chart.png 1,198 × 604; 41 KB
-
LengthErrorDistribution.png 1,200 × 800; 21 KB
-
Periodicity in the frequency pagetiming inconsistencies.png 1,173 × 592; 14 KB
-
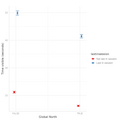
Plot reading time discrepencies overall.png 1,649 × 817; 48 KB
-
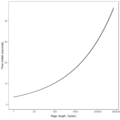
Plot visible length discrepencies overall.png 1,824 × 925; 75 KB
-
Reading time on enwiki weibull hazard function 2018.png 922 × 491; 12 KB
-
Reading time on enwiki weibull survival function 2018.png 901 × 491; 18 KB
-
Reading Time wikimania 2019 slides.pdf 1,889 × 531, 40 pages; 447 KB
-
ReadingDepth Model1 Secret Weapon on Select Wikis.png 840 × 840; 65 KB
-
Screenshot from 2018-10-25 16-13-47 Wikipedia reading depth project.png 1,920 × 1,080; 232 KB
-
Weibull dist enwiki.png 912 × 491; 16 KB
-
Wikipedia Readership Dwell Weibull Plots.png 1,072 × 3,232; 126 KB
-
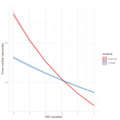
Wikipedia reading time - Model 1a - Hypothesis 1.png 840 × 840; 16 KB
-
Wikipedia reading time - Model 1a - Hypothesis 2 and 3.png 840 × 840; 44 KB
-
Wikipedia reading time - Model 1a - Hypothesis 2.png 840 × 840; 46 KB
-
Wikipedia reading time - Model 1a - Hypothesis 3.png 840 × 840; 39 KB
-
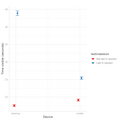
Wikipedia reading time - model 1b - device marginal effect.png 840 × 840; 9 KB
-
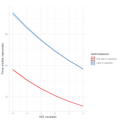
Wikipedia reading time - Model 1b - Hypotheses 2 and 3.png 840 × 840; 27 KB
-
Wikipedia reading time - Model 1b - Hypothesis 1.png 840 × 840; 8 KB
-
Wikipedia reading time - Model 1b - Hypothesis 2.png 840 × 840; 19 KB
-
Wikipedia reading time - Model 1b - Hypothesis 3.png 840 × 840; 21 KB
-
Wikipedia reading time - parametric hazard functions - enwiki.png 865 × 546; 53 KB
-
Wikipedia reading time - time page visible - by wikis - all wikis.png 1,236 × 7,768; 838 KB
-
Wikipedia reading time modeling --- Plot residuals by HDI * mobile.png 840 × 840; 104 KB
-
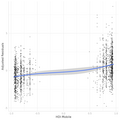
Wikipedia reading time modeling --- Plot residuals by HDI.png 840 × 840; 107 KB
-
Wikipedia reading time--- Model 3 residuals Histogram.png 840 × 840; 9 KB
-
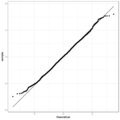
Wikipedia reading time--- Model 3 residuals QQ plot.png 840 × 840; 16 KB
-
Wikipedia reading time-all languages-histograms.png 992 × 705; 27 KB
-
WP page visible time histograms by select wikis.png 1,165 × 684; 37 KB
-
Wp reading time errors by browsers.png 1,385 × 665; 70 KB
-
WP reading time errors by country.png 5,631 × 908; 68 KB
-
WP reading time errors by IP block.png 1,025 × 1,025; 67 KB
-
WP reading time errors by IP type.png 689 × 305; 18 KB
-
WP reading time prop errors by country.png 5,627 × 908; 58 KB
-
WP ReadingTime TotalTimeDist 9-24-2018.png 1,200 × 800; 20 KB
-
WP server log time delta minus browser totallength.png 1,645 × 1,803; 133 KB


