Category:Visual analytics
Jump to navigation
Jump to search
area of research | |||||
| Upload media | |||||
| Instance of |
| ||||
|---|---|---|---|---|---|
| Subclass of | |||||
| Has use | |||||
| |||||
Visual analytics is an outgrowth of the fields Information visualization and Scientific visualization, that focusses on analytical reasoning facilitated by interactive visual interfaces.
Subcategories
This category has the following 3 subcategories, out of 3 total.
C
O
Media in category "Visual analytics"
The following 13 files are in this category, out of 13 total.
-
Automating Flow Map Layout.jpg 823 × 652; 46 KB
-
Integrated Genome Browser version 9.1.0 home screen.png 1,165 × 720; 290 KB
-
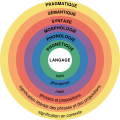
Major levels of linguistic structure-fr.svg 900 × 900; 107 KB
-
Major levels of linguistic structure.svg 900 × 900; 70 KB
-
Network bot drill down compromised areas.JPG 1,196 × 948; 290 KB
-
News visualization.jpg 525 × 635; 63 KB
-
Terrain-samples-in-dataset-DS1.jpg 660 × 330; 231 KB
-
TiBoR Time-Bounded Reasoning Agent for Information.jpg 668 × 450; 48 KB
-
Visual Analysis of Activity in Bank Transactions.jpg 600 × 575; 60 KB
-
VisualAnalyticsWorkflow.svg 443 × 237; 40 KB


