Category:Vertical bar charts
Jump to navigation
Jump to search
bar chart with vertical bars | |||||
| Upload media | |||||
| Instance of | |||||
|---|---|---|---|---|---|
| Different from | |||||
| |||||
Subcategories
This category has the following 7 subcategories, out of 7 total.
*
3
- Vertical 3D bar charts (205 F)
G
- Vertical grouped bar charts (227 F)
H
- Vertical histograms (324 F)
S
Media in category "Vertical bar charts"
The following 200 files are in this category, out of 918 total.
(previous page) (next page)-
2005-Herbst.png 742 × 526; 19 KB
-
360搜索市场份额变化图表(2012-2015).png 968 × 635; 43 KB
-
6 Umweltschutzgueter.jpg 1,058 × 600; 229 KB
-
92~101學年度 eCampus 登入人次(不含訪客).jpg 806 × 444; 83 KB
-
92~101學年度 eCampus 課程使用百分比.jpg 806 × 444; 118 KB
-
Abdunance C19orf67.png 379 × 286; 20 KB
-
Absolut-majoritet.jpg 553 × 314; 29 KB
-
Absolutes Vermögen deutscher Haushalte nach Vermögensgruppe.png 380 × 713; 19 KB
-
Afli Atka makríls eftir löndum á 5 ára fresti frá 1960-2000.png 472 × 282; 25 KB
-
Afliítonnum.png 803 × 274; 15 KB
-
AFTv5.phase 2.utility prop.by experiment.by aggregation.barplot.png 2,048 × 1,024; 56 KB
-
AFTv5.phase 2.utility.by intention.by experiment.png 2,048 × 768; 52 KB
-
Altersvorsorge.png 427 × 438; 11 KB
-
AnimeFilms10BillionYen.png 512 × 341; 48 KB
-
Aotquemaynoquema.png 828 × 306; 33 KB
-
Apendix fig1 normality.png 512 × 348; 15 KB
-
App-graph.PNG 443 × 326; 6 KB
-
AromataseMushrooms.jpg 950 × 238; 25 KB
-
Article par million d'habitants.jpg 2,048 × 686; 82 KB
-
Asignación de votos APNU.png 530 × 452; 26 KB
-
Assets'14.png 619 × 412; 17 KB
-
ATG14 - aminoácidos mutados y cáncer.png 558 × 525; 6 KB
-
Audiences TV 2017.png 720 × 320; 37 KB
-
Audiencias Gran Hermano (España).png 481 × 288; 16 KB
-
Australian feminists articles by language.png 1,382 × 909; 93 KB
-
Autoconfirmed new user article status comparison.png 600 × 371; 13 KB
-
Avalon dissimilarity.png 616 × 441; 9 KB
-
Average Costs from 2010 to 2011.JPG 482 × 288; 29 KB
-
Average Length of Stay 2010 to 2011.JPG 479 × 288; 29 KB
-
Average Numbers of Patients from 2010 to 2011.JPG 482 × 289; 24 KB
-
Average-wage-in-czech-republic.PNG 785 × 505; 25 KB
-
Aviation bunker fuel emissions in the 21 highest emitting Annex I countries.jpg 2,748 × 2,107; 385 KB
-
Back to sleep plot.png 1,500 × 1,125; 164 KB
-
Bae systems financial information 1999 - 2017.png 3,573 × 2,318; 202 KB
-
Balancemibel.png 557 × 352; 30 KB
-
Bambini che non frequentano la scuola primaria.jpg 432 × 541; 40 KB
-
Banjar Gender Wikiproject.png 913 × 647; 62 KB
-
Bank-of-England-1920-44.jpg 900 × 614; 88 KB
-
Banque de compensationUSA2005.jpg 775 × 786; 131 KB
-
BanzhafPowerIndex.jpg 478 × 603; 80 KB
-
Bar chart showing top 50 countries by count of women on Wikidata.png 1,852 × 865; 33 KB
-
Bar chart, historical book production.png 1,820 × 963; 33 KB
-
Bar chart.jpg 1,617 × 1,108; 136 KB
-
Bar Chart.png 1,117 × 641; 31 KB
-
Bar graph - stock price statistics.jpg 999 × 579; 58 KB
-
Barch Evaluation0.JPG 624 × 500; 36 KB
-
Barch MetrMM0.JPG 624 × 500; 91 KB
-
Barchart007.png 480 × 480; 3 KB
-
Barns internetanvändning.jpg 1,200 × 800; 73 KB
-
Barplot 3.png 267 × 206; 30 KB
-
Barplot001.png 651 × 488; 10 KB
-
Barra diagrama 003.png 480 × 480; 3 KB
-
Barra diagrama kuantitatiboa 001.pdf 1,350 × 1,350; 4 KB
-
BC elections2.gif 1,057 × 659; 32 KB
-
Beitrag CO-Konzentration 2014.jpg 549 × 428; 82 KB
-
Belgien - Neue Lehrverträge pro Jahr.png 460 × 229; 12 KB
-
BEST-e-revenues.png 583 × 460; 4 KB
-
BEST-t-revenues.png 514 × 406; 4 KB
-
BestTestAverages0to100.png 850 × 579; 54 KB
-
BestTestAverages50to100.png 850 × 579; 51 KB
-
Beulah AHSGE 2010.PNG 799 × 580; 22 KB
-
Bevölkerungsentw. Montana 1890-2003.png 497 × 330; 10 KB
-
BienenVolk.png 605 × 340; 8 KB
-
BienenVolkB.png 605 × 340; 9 KB
-
Billionaire wealth.png 1,459 × 724; 219 KB
-
BioGWP.JPG 580 × 355; 28 KB
-
BioSLCA.JPG 768 × 410; 25 KB
-
Birling Occupational Structure 1881.jpg 481 × 288; 24 KB
-
Blockingmiserlou.PNG 400 × 137; 3 KB
-
Botola buts 2011 1.JPG 472 × 278; 26 KB
-
Bryophyte Substrate dependance data, Growling Swallet, Tasmania, 2015.png 1,676 × 1,207; 102 KB
-
Buginese Gender Wikiproject.png 1,044 × 704; 69 KB
-
Building ages (33444399651).gif 481 × 288; 16 KB
-
Busiest container ports.png 571 × 387; 36 KB
-
C19orf67 Protein Abdunance.png 840 × 557; 19 KB
-
C3orf62 Tissue Expression.png 1,607 × 346; 16 KB
-
C5orf36 mRNA expression data.png 895 × 306; 42 KB
-
C5orf36 Protein expression.png 892 × 304; 58 KB
-
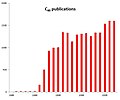
C60 publications.jpg 612 × 508; 24 KB
-
Calc Tutoriel2 ill1.jpg 500 × 330; 37 KB
-
Calificaciones.png 472 × 289; 12 KB
-
Calmlink filled graph with markers s.jpg 483 × 318; 35 KB
-
Canada - Cases (Apr 23, 2022).png 1,577 × 742; 63 KB
-
Canada - Deaths (Dec 1, 2021).png 1,055 × 735; 46 KB
-
Cardiac Figure 5.jpg 396 × 357; 26 KB
-
Cardiac Figure 6.jpg 789 × 383; 43 KB
-
Cavities in the US increase with age.tiff 1,788 × 1,287; 162 KB
-
Cavitues in the US increase with age.jpg 600 × 432; 57 KB
-
Cetnost.PNG 682 × 411; 23 KB
-
CH-Verkehrsunfallstatistik-nach-Alter-und-Geschlecht(2011).png 1,590 × 904; 33 KB
-
Change in death rate on 8000ers from before 1990 to 1990 - 2003.png 1,098 × 596; 33 KB
-
ChangeinmediannetworthUS1992-2004.png 578 × 346; 4 KB
-
Changesets year 2013.png 605 × 340; 5 KB
-
Chart comparing breeds.png 737 × 460; 31 KB
-
Chart comparing lifespan of breeds.png 742 × 455; 24 KB
-
Chart number 2.png 468 × 426; 25 KB
-
Chart number 3.jpg 524 × 470; 30 KB
-
Chart number 5.png 674 × 670; 45 KB
-
Chart number 6.png 477 × 507; 30 KB
-
Chart number 7.png 685 × 643; 30 KB
-
Chinese Pork Production and Consumption (11718363396).jpg 1,651 × 901; 211 KB
-
Chrat number 1.png 693 × 736; 42 KB
-
Ci-elections-graphique.jpg 942 × 850; 159 KB
-
Citations to Q-Chem as of 2011.png 566 × 297; 9 KB
-
Cizelge.jpg 206 × 238; 37 KB
-
CLA00.png 593 × 415; 42 KB
-
CLA01.png 526 × 385; 33 KB
-
Cleanup marathon 2016 May 03.png 981 × 372; 16 KB
-
Cleanup marathon 2016 May 06.png 505 × 414; 7 KB
-
Client acropolis.png 750 × 588; 20 KB
-
Clifford occupations 2011.jpg 718 × 439; 48 KB
-
Climate-data.png 600 × 400; 25 KB
-
Coca Cultivation.png 809 × 498; 44 KB
-
Consommateurs avis.png 848 × 600; 68 KB
-
Constituents per Member of Congress.png 666 × 515; 22 KB
-
Copy of 1831 Occupational Categories.pdf 1,239 × 1,752; 104 KB
-
Corsican Gender Wikiproject.png 994 × 687; 63 KB
-
Counted Inhabitants.png 488 × 373; 5 KB
-
Counterfeits chart.jpg 490 × 325; 32 KB
-
Courbe épidémie par Propagation.jpg 415 × 242; 20 KB
-
Courbe épidémique agrégation temporelle.jpg 415 × 609; 29 KB
-
Courbe épidémique avec cas cumulés.jpg 415 × 250; 14 KB
-
Courbe épidémique Source commune continue 2.jpg 415 × 250; 20 KB
-
Courbe épidémique Source commune continue.jpg 415 × 250; 14 KB
-
Courbe épidémique Source commune intermittente.jpg 415 × 250; 13 KB
-
Courbe épidémique Source commune ponctuelle.jpg 415 × 250; 16 KB
-
Courbe épidémique temps d'incubation.jpg 542 × 292; 22 KB
-
Courbe épidémique Variation géo.jpg 641 × 443; 83 KB
-
CropYield.png 446 × 223; 20 KB
-
Cumulative geographical distribution of participants.png 1,215 × 621; 53 KB
-
Customs Duties Forecast Chart.png 1,836 × 1,176; 132 KB
-
Czadatak.jpg 484 × 280; 18 KB
-
Daglig användning av internet bland barn.jpg 1,200 × 800; 74 KB
-
Darlington Nuclear Unit Capability 2003-2011.jpg 960 × 720; 58 KB
-
Dashboard.png 745 × 561; 16 KB
-
Data Source World Bank.png 1,467 × 867; 75 KB
-
Death rates on 8000ers 1990- 2003.png 1,119 × 601; 33 KB
-
DeathChart.jpg 536 × 361; 32 KB
-
Deleter activity.png 1,800 × 900; 99 KB
-
Delhi2013rapeStats.jpg 1,024 × 768; 72 KB
-
Demande mondiale fibres.png 732 × 399; 1.12 MB
-
Demografía de Arenas de San Pedro..png 884 × 458; 30 KB
-
Demographics of High Laver using data from the 2011 census.jpg 480 × 289; 35 KB
-
Deportations under Title 42 by month.jpg 1,747 × 354; 172 KB
-
Depression 2.jpg 717 × 539; 172 KB
-
Diagramm5AHausAuto.png 519 × 353; 16 KB
-
Diagramm6ASchulBuch.png 488 × 479; 21 KB
-
Diagramm6FKlasseSchuler.png 494 × 487; 23 KB
-
Diagramme02.svg 1,283 × 751; 68 KB
-
Diagramme02B.svg 1,283 × 751; 102 KB
-
DIFFERENCE SALAIRES HOMME FEMME.jpg 521 × 285; 19 KB
-
Directions-loading-r.JPG 454 × 291; 23 KB
-
Directions-loading-tr.JPG 452 × 291; 23 KB
-
Disparitaetendiagramm.png 3,317 × 2,083; 191 KB
-
Distr-routes.jpg 453 × 291; 21 KB
-
Domestic & international bunker fuel emissions as share of national total (%).jpg 2,759 × 1,858; 248 KB
-
Domestic violence statistics 2008-2009, Fresno CA.jpg 799 × 523; 35 KB
-
Double bar chart 01.svg 600 × 600; 10 KB
-
DPH.png 1,504 × 931; 144 KB
-
Druckerfx.png 780 × 600; 91 KB
-
Dutch Gender Wikiproject.png 1,315 × 1,068; 79 KB
-
Eastons Occupation Structure 1881.png 577 × 337; 17 KB
-
ECOLCA Greenhouse gases.jpg 609 × 387; 31 KB
-
Economic growth usa.png 1,067 × 678; 38 KB
-
Eichfeld (Steiermark), Einwohnerentwicklung.jpg 1,001 × 639; 65 KB
-
EIOLCA1.jpg 603 × 382; 34 KB
-
EIOLCA3.jpg 597 × 382; 32 KB
-
Elecciones 2015 3F.png 580 × 423; 14 KB
-
Elecciones 2017 3F.png 663 × 425; 15 KB
-
Electric Energy Consumption - Monthly Deviations from Average.jpg 389 × 289; 32 KB
-
Electricity generation chart.jpg 1,200 × 800; 88 KB
-
Elsa Name Graph US.jpg 754 × 454; 70 KB
-
Elsa Name Graph US.svg 1,005 × 605; 8 KB
-
En-admin-growth.png 974 × 600; 20 KB
-
En-admin-vs-article-growth.png 974 × 600; 26 KB
-
Energiegenossenschaften.jpg 752 × 451; 32 KB
-
Energy consumption by compressor type.jpg 849 × 499; 71 KB
-
Energy graph.JPG 616 × 384; 23 KB
-
Energy use.PNG 913 × 664; 20 KB
-
Energy-Fiber.JPG 292 × 771; 24 KB
-
Energy-Matrix.JPG 292 × 771; 25 KB
-
Energy-Total.JPG 292 × 771; 18 KB
-
Energyinput pr.jpg 276 × 358; 12 KB
-
Enrollment.jpg 358 × 280; 12 KB
-
Entourage.jpg 517 × 372; 25 KB
-
EPAs main tasks.png 577 × 409; 5 KB
-
ESB Membership by Country, 1976.tif 803 × 732; 119 KB


