Category:Valid SVG created with R code
Jump to navigation
Jump to search
Subcategories
This category has only the following subcategory.
C
- Control charts created with R (10 F)
Media in category "Valid SVG created with R code"
The following 108 files are in this category, out of 108 total.
-
 Abschiebungen.svg 1,350 × 810; 147 KB
-
 Acf new.svg 217 × 289; 35 KB
-
 Anscombe's quartet 3.svg 990 × 720; 59 KB
-
 Bacterial and archeal genome sequences submitted to Genbank.svg 1,350 × 450; 46 KB
-
 BaseRscatter.svg 630 × 630; 48 KB
-
 Besucher.svg 459 × 450; 33 KB
-
 Bevoelkerungsentwicklung in Oesterreich.svg 1,350 × 810; 68 KB
-
 Bevölkerungsentwicklung DDR.svg 1,350 × 810; 54 KB
-
 Bevölkerungsentwicklung Deutschland Variante.svg 1,350 × 810; 48 KB
-
 Bevölkerungsentwicklung Deutschland.svg 1,350 × 810; 71 KB
-
 Bevölkerungsentwicklung in Deutschland (Nationalität).svg 1,350 × 810; 95 KB
-
 Bevölkerungsentwicklung Schweiz.svg 1,350 × 810; 78 KB
-
 Biplot of Anderson's Iris data set.svg 540 × 540; 84 KB
-
 BivariateOutlier.svg 756 × 541; 14 KB
-
 Black cherry tree histogram.svg 216 × 216; 4 KB
-
 Cers-spot-prices-2012.svg 614 × 470; 10 KB
-
 China-primary-energy-ej-2009v1.svg 614 × 470; 8 KB
-
 CIE 1931 RGB colour matching functions.svg 576 × 432; 57 KB
-
 Circle area Monte Carlo integration2.svg 723 × 723; 188 KB
-
 Circle art.svg 270 × 270; 218 KB
-
 Coupon collectors problem expectation.svg 630 × 630; 281 KB
-
 Coupon collectors problem simulation.svg 630 × 630; 561 KB
-
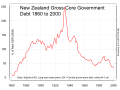 Debt to GDP ratio New Zealand Government timeseriesnotitle 720by540.svg 720 × 540; 117 KB
-
 Deutschland Bevölkerung.svg 1,350 × 810; 76 KB
-
 Double bar chart 01.svg 600 × 600; 10 KB
-
 English dialects1997.svg 269 × 260; 12 KB
-
 EROI - Ratio of Energy Returned on Energy Invested - USA.svg 578 × 434; 12 KB
-

-
 ETS-allowance-prices.svg 720 × 540; 401 KB
-
 European Allowance prices.svg 720 × 540; 111 KB
-
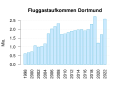 Fluggastaufkommen Dortmund.svg 768 × 576; 40 KB
-
 Four Correlations.svg 1,000 × 1,000; 6.73 MB
-
-
 Gauss-chebychev-integration.svg 377 × 522; 14 KB
-
 Gdp to debt ratio.svg 1,800 × 1,440; 377 KB
-
 Genotype phenotype regression.svg 360 × 360; 378 KB
-
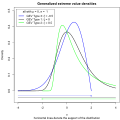 GevDensity.svg 630 × 630; 116 KB
-
 Ggplot2 scatter plot.svg 703 × 515; 58 KB
-
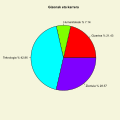 Gizona karrera pie 01.svg 508 × 508; 34 KB
-
 Global Temperatures 1880-2012 according to Nasa.svg 720 × 450; 77 KB
-
 Henry droite 0001.svg 723 × 578; 6 KB
-
 Herd Immunity Threshold.svg 630 × 630; 66 KB
-
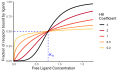 Hill-Langmuir equation.svg 450 × 270; 107 KB
-
 Histogramme age hommes france 2009 GNU R.svg 635 × 878; 170 KB
-
 Histogramme tirage aléatoire normale 100 valeurs GNU R.svg 687 × 639; 50 KB
-
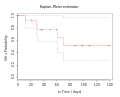 Kaplan-Meier-sample-plot.svg 521 × 419; 31 KB
-
 Karplus.svg 630 × 630; 27 KB
-
 Linear regression plot with R.svg 630 × 630; 30 KB
-
 Mass aids hs taxa acumulada.svg 630 × 630; 82 KB
-
 Mauigasfield.svg 578 × 434; 7 KB
-
 Monty Hall frequencies.svg 630 × 630; 58 KB
-
 Movingaverage twomethods 001.svg 723 × 578; 4 KB
-
 Ncbi-prok-genomesize.svg 1,260 × 720; 917 KB
-
 New Zealand atmospheric methane concentrations.svg 768 × 576; 113 KB
-
 New Zealand aviation emissions of greenhouse gases.svg 720 × 540; 152 KB
-
 New Zealand balance of payments net international debt.svg 720 × 540; 139 KB
-
 New Zealand co2 percapita compared.svg 506 × 434; 10 KB
-
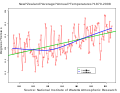 New Zealand temp-1971-2008.svg 650 × 506; 30 KB
-
 NewZealandElectricityGeneratingCapacity.svg 564 × 477; 6 KB
-
 Number of prokaryotic genomes and sequencing costs.svg 1,350 × 900; 145 KB
-
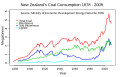 NZ coal consumption 1878 2009.svg 564 × 361; 14 KB
-
 NZ Govt debt 1990-2011.svg 578 × 434; 15 KB
-
 Nz-gas-production-m3.svg 578 × 434; 8 KB
-
 NZ-T7-land-temp-anom-720by540-v1.svg 720 × 540; 143 KB
-
 NzGDPdata 720by540.svg 768 × 576; 185 KB
-
 Nzghg-sector w7 h6-2007.svg 506 × 434; 4 KB
-
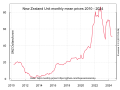 NZU-NZ-emission-unit-720by540.svg 768 × 576; 104 KB
-
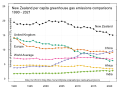 Per capita greenhouse gas emissions.svg 720 × 540; 188 KB
-
 Petrol-ets-2010-2015.svg 720 × 540; 211 KB
-
 Plot cubic polynomial.svg 630 × 630; 184 KB
-
 Plots from lm example.svg 540 × 540; 111 KB
-
 Population Development Austria.svg 1,350 × 810; 65 KB
-
 Population Development Germany.svg 1,350 × 810; 65 KB
-
 Population development of Germany (Nationality).svg 1,350 × 810; 81 KB
-
 Population Development Switzerland.svg 1,350 × 810; 75 KB
-
 Population of Germany.svg 1,350 × 810; 72 KB
-
 Pre-term corticosteroid data.svg 684 × 309; 95 KB
-
 Puntuhodeia 0001.svg 723 × 578; 6 KB
-
 Pyramide ages france 2009 GNU R.svg 430 × 792; 114 KB
-
 R-basic sqrt plot example.svg 360 × 360; 30 KB
-
 R-US state areas-basicboxplot+colour.svg 450 × 135; 64 KB
-
 R-US state areas-boxplot log+extras.svg 450 × 135; 96 KB
-
 R-US state areas-boxplot log.svg 450 × 135; 38 KB
-
 R-US state areas-boxplot sqrt+extras.svg 450 × 135; 97 KB
-
 R-US state areas-boxplot sqrt.svg 450 × 135; 35 KB
-
 R-US state areas-boxplot.svg 450 × 135; 78 KB
-
 Reg ls dgr resid t ajust2.svg 630 × 630; 70 KB
-
 Regression plane avec R.svg 268 × 240; 19 KB
-
 Risk Ratio vs Odds Ratio.svg 300 × 244; 68 KB
-
 Rückführungen aus der Schweiz.svg 1,350 × 810; 151 KB
-
 Secretary problem n 10.svg 630 × 630; 27 KB
-
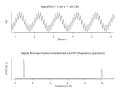 Simple time domain vs frequency domain.svg 512 × 398; 30 KB
-
 Simpsons-vector.svg 430 × 430; 5 KB
-
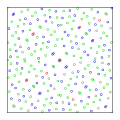 Sobol sequence 2D.svg 289 × 289; 36 KB
-
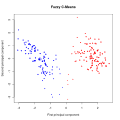 Swiss cmeans.svg 630 × 630; 109 KB
-
 UK EU referendum polling cy.svg 900 × 630; 332 KB
-
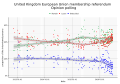 UK EU referendum polling.svg 900 × 630; 329 KB
-
 Unendlichkeitsmaschine Page Views.svg 553 × 463; 69 KB
-
 US-gas-production-1900-2011.svg 650 × 506; 7 KB
-
-
 Usage share of web servers (Source Netcraft) 1995-2005.svg 1,080 × 630; 73 KB
-
 Usage share of web servers (Source Netcraft).svg 1,080 × 630; 86 KB
-
 Wanderungsbilanz Deutschland.svg 1,350 × 810; 123 KB
-
 Wanderungssaldo Deutschland.svg 1,350 × 810; 127 KB
-
 Windrose Jork 2015.svg 505 × 580; 414 KB
-
 Ws-el-price-2009-2012red.svg 578 × 434; 44 KB
-
 WSPR 2014.svg 540 × 450; 136 KB
-
 Wybory do sejmików - głosy nieważne w województwach 2002-2014.svg 720 × 810; 2.13 MB


.svg)


.svg)


_up_to_Q4_2011.svg)
_1995-2005.svg)
.svg)


