Category:United States presidential election statistics
Jump to navigation
Jump to search
Subcategories
This category has the following 3 subcategories, out of 3 total.
Media in category "United States presidential election statistics"
The following 37 files are in this category, out of 37 total.
-
Electoral college win popular vote lost US Presidents.png 792 × 567; 19 KB
-
EVOLUTIONS PRESIDENTIELLES EN ILLINOIS.png 747 × 423; 20 KB
-
GeorgiaPresidentialVoteChart1948-2008.jpg 751 × 311; 57 KB
-
PartyVotes-Presidents.png 1,580 × 700; 43 KB
-
PartyVotes-PresidentsWhoHadBeenVicePresidents.png 1,530 × 700; 81 KB
-
PartyVotes.png 1,555 × 664; 22 KB
-
Politique USA.PNG 991 × 614; 31 KB
-
PRESIDENTIELLES AMERICAINES DANS L' ILLINOIS.png 736 × 413; 13 KB
-
U.S. Vote for President as Population Share.png 699 × 462; 84 KB
-
United States presidential election ordinal results bar graph (Expanded).png 9,000 × 3,600; 194 KB
-
United States presidential election ordinal results bar graph.png 5,000 × 3,600; 138 KB
-
United States presidential election ordinal results line graph (Expanded).png 4,657 × 3,600; 356 KB
-
United States presidential election ordinal results line graph.png 4,657 × 3,600; 207 KB
-
United States presidential election raw popular vote count bar graph (Expanded).png 9,450 × 11,500; 578 KB
-
United States presidential election raw popular vote count bar graph.png 5,450 × 11,500; 389 KB
-
United States presidential election raw popular vote count line graph (Expanded).png 5,107 × 11,500; 732 KB
-
United States presidential election raw popular vote count line graph.png 5,107 × 11,500; 642 KB
-
United States presidential election results bar graph (Expanded).png 9,000 × 7,000; 318 KB
-
United States presidential election results bar graph.png 5,000 × 7,000; 207 KB
-
United States presidential election results line graph (Expanded).png 4,657 × 7,000; 507 KB
-
United States presidential election results line graph.png 4,657 × 7,000; 443 KB
-
United States Presidents popular vote losers.png 602 × 567; 14 KB
-
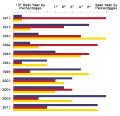
US Presidential elections popular vote graph since 1900.png 1,080 × 551; 18 KB
-
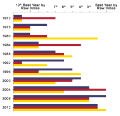
US Presidential elections popular votes since 1900.png 1,336 × 551; 20 KB
-
US Vote for President as Share of Population.png 2,604 × 1,640; 343 KB
-
USA Presidential Elections Turnout by Share of Population.png 2,604 × 1,640; 338 KB
-
UsPresidentialElectionVoterTurnout19482020.png 901 × 558; 39 KB
-
Voter Turnout by Age 2012 US Presidential Election.png 1,633 × 1,051; 31 KB
-
Voter Turnout by Education 2012 US Presidential Election.png 1,567 × 1,081; 32 KB
-
Voter Turnout by Race-Ethnicity 2012 US Presidential Election.png 1,549 × 1,086; 28 KB
-
Voter turnout.png 1,022 × 606; 49 KB


