Category:United States federal budget
Jump to navigation
Jump to search
budget of the U.S. federal government | |||||
| Upload media | |||||
| Subclass of | |||||
|---|---|---|---|---|---|
| Location |
| ||||
| |||||
Subcategories
This category has the following 14 subcategories, out of 14 total.
2
C
G
H
M
U
Media in category "United States federal budget"
The following 185 files are in this category, out of 185 total.
-
1b-ACA Distribution in 2014.png 1,264 × 790; 210 KB
-
2010 Federal Budget Treemap.tif 987 × 546; 528 KB
-
2010 National Spending of the USA compared to G20.jpg 1,412 × 700; 109 KB
-
2010 National Spending per GDP comparison.jpg 1,385 × 773; 81 KB
-
2013 Government Expenditure in the United States.png 1,024 × 768; 28 KB
-
2017 House budget.pdf 1,275 × 1,650, 54 pages; 65 KB
-
2018 Federal Budget Infographic.png 790 × 683; 129 KB
-
2018 Total US Government Spending Breakdown.png 890 × 522; 29 KB
-
2019 budget outlook CBO.png 825 × 550; 28 KB
-
2019 Federal Budget Infographic.png 993 × 855; 173 KB
-
2020 Total US Government Spending Breakdown.png 890 × 502; 26 KB
-
2020 US Federal Budget Infographic.png 893 × 802; 243 KB
-
2020 US Federal Revenues and Outlays.png 708 × 472; 59 KB
-
2021 US Federal Budget Infographic.png 799 × 801; 185 KB
-
2021 US Federal Discretionary Outlays.png 785 × 555; 115 KB
-
2021 US Federal Mandatory Outlays.png 837 × 582; 153 KB
-
2021 US Federal Revenues.png 785 × 494; 68 KB
-
2022 US Federal Budget Infographic Simple.png 481 × 400; 34 KB
-
2022 US Federal Budget Infographic.png 977 × 985; 330 KB
-
2022 US Federal Discretionary Outlays.png 1,021 × 780; 123 KB
-
2022 US Federal Mandatory Outlays.png 1,033 × 668; 139 KB
-
2022 US Federal Revenues.png 1,027 × 740; 83 KB
-
2023 Interest on federal debt.png 574 × 385; 69 KB
-
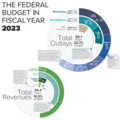
2023 US Federal Budget Infographic.png 756 × 759; 186 KB
-
2023 US Federal Discretionary Outlays.png 1,028 × 769; 129 KB
-
2023 US Federal Mandatory Outlays.png 1,028 × 719; 199 KB
-
2023 US Federal Revenues.png 1,028 × 737; 90 KB
-
Annual Federal Deficit as a percent of GDP.svg 1,549 × 478; 294 KB
-
ATRA Deficit Scenarios - v1.png 1,288 × 708; 133 KB
-
Average Interest Rate on U.S. Federal Debt.webp 4,502 × 1,601; 67 KB
-
BILLS-115hr1628rh.pdf 1,275 × 1,650, 126 pages; 413 KB
-
Cause of change from deficit in 1994 to surplus in 2001.png 1,234 × 720; 55 KB
-
CBO - 2017 Tax Act Table.png 1,409 × 786; 307 KB
-
CBO - Budgetary Effects of Largest Tax Expenditures 2017 to 2026.png 1,032 × 837; 149 KB
-
CBO - Revenues and Outlays as percent GDP.png 960 × 720; 119 KB
-
CBO - Revenues and Outlays as percent GDP.svg 648 × 286; 17 KB
-
CBO 2017 Current Law Baseline -v1.png 875 × 464; 69 KB
-
CBO 2018 Current Law Baseline.png 1,058 × 698; 129 KB
-
CBO debt milestone timeline.png 1,578 × 518; 242 KB
-
CBO Deficit - Baseline Comparison - April 2018.png 1,280 × 720; 59 KB
-
CBO Deficit Baseline Change June 2017 to April 2018.png 1,280 × 720; 255 KB
-
CBO Deficits as pct GDP.png 1,290 × 595; 152 KB
-
CBO Deficits pct GDP 1967-2027.png 1,280 × 720; 189 KB
-
CBO Deficits pct GDP 1968-2028.png 1,098 × 670; 55 KB
-
CBO Forecast Changes for 2009-2012.png 960 × 720; 15 KB
-
CBO Forecast Comparison - Obama and GW Bush - v1.png 1,410 × 776; 222 KB
-
CBO Infographic 2016.png 1,622 × 782; 404 KB
-
CBO Infographic 2017.png 989 × 860; 205 KB
-
CBO Score of Tax Cuts and Jobs Act of 2017.png 1,060 × 822; 242 KB
-
CBO Social Security Revenues and Outlays Forecast 2015-2085.png 1,401 × 686; 150 KB
-
CBO tax expenditures panel v1.png 1,315 × 731; 296 KB
-
CBO U.S. Federal Spending as Pct GDP 2013-2024.png 960 × 720; 177 KB
-
Comparative Revenue and Spending Increases.png 960 × 720; 6 KB
-
Congressional Budget Office report 2019-01-28 - The Budget and Economic Outlook - 2019 to 2029.pdf 1,275 × 1,650, 176 pages; 3.77 MB
-
Defense Spending as a Percent of GDP.png 5,202 × 1,405; 249 KB
-
Defense spending.png 4,417 × 1,929; 276 KB
-
Deficit impact of AHCA and BCRA - v1.png 670 × 725; 178 KB
-
Deficit to Change in Debt Comparison 2007.png 960 × 720; 8 KB
-
Discretionary Spending 2019 Budget.jpg 908 × 574; 67 KB
-
Discretionary Spending FY2013.svg 825 × 598; 422 KB
-
Discretionary Spending Under CBO 2010 and 2013 Baselines.png 960 × 720; 8 KB
-
Fed Budget SSHA 2014.png 800 × 600; 87 KB
-
Federal Budget (1990-2000).svg 600 × 400; 21 KB
-
Federal budget 2022.webp 1,044 × 867; 76 KB
-
Federal Budget Deficit 2016 - 2018E.png 1,307 × 783; 29 KB
-
Federal Budget Deficit or Surplus over time as of 2023.png 595 × 381; 41 KB
-
Federal budget outlays percentage.png 5,000 × 4,000; 819 KB
-
Federal debt held by public CBO 2019.png 750 × 569; 29 KB
-
Federal Government annual spending and revenue.webp 4,658 × 2,026; 153 KB
-
Federal Government deficits.webp 4,416 × 1,719; 172 KB
-
Federal Government Revenue By Type.webp 1,568 × 550; 55 KB
-
Federal Government tax revenue and expenditures.webp 4,411 × 1,045; 76 KB
-
Federal interest payments 2023.webp 3,860 × 1,476; 42 KB
-
Federal interest payments.webp 5,837 × 1,882; 102 KB
-
Federal revenue adjusted for inflation.webp 1,584 × 399; 55 KB
-
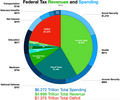
Federal Revenue and Spending.png 1,170 × 866; 369 KB
-
Federal Spending by President - Carter to Obama - v1.png 1,345 × 778; 39 KB
-
Federal spending vs revenue.pdf 2,612 × 718; 489 KB
-
Federal Spending.png 589 × 356; 13 KB
-
Federal spendings.gif 543 × 726; 37 KB
-
Federal spendings.png 543 × 726; 12 KB
-
Fiscal Reform Commission - Public Debt Projections.png 960 × 720; 33 KB
-
FY10 Federal Budget Galaxy Chart.png 3,000 × 4,000; 650 KB
-
Fy2007spendingbycategory.png 870 × 628; 397 KB
-
Fy2009spendingbycategory2.png 870 × 628; 77 KB
-
Fy2010 spending by category.jpg 870 × 628; 75 KB
-
GAO 2018 debt projection.png 1,079 × 698; 113 KB
-
GAO Slide.png 960 × 720; 273 KB
-
Government Expenditure in the United States.png 1,024 × 768; 28 KB
-
Government Revenue and spending GDP.png 5,079 × 1,681; 578 KB
-
Growth Rates GDP vs. Entitlements.png 960 × 720; 463 KB
-
Harold Washington at rally for "fair federal budget" (9516904119).jpg 2,065 × 2,752; 653 KB
-
InflationAdjustedDefenseSpending.PNG 1,179 × 539; 63 KB
-
Infrastructure Investment and Jobs Act Summary.png 1,322 × 717; 62 KB
-
Interest expense on the U.S. national debt.png 865 × 610; 110 KB
-
Kings County WIC Office - Hanford CA.jpg 3,072 × 2,304; 1.95 MB
-
Lhhist2.jpg 532 × 518; 29 KB
-
Mandatory Spending as a Percent of the Federal Budget.png 1,113 × 571; 21 KB
-
Mandatory Spending for FY 2016.png 1,020 × 633; 55 KB
-
Mandatory Spending.jpg 792 × 470; 51 KB
-
Medicare & Social Security Deficits Chart.png 960 × 720; 509 KB
-
Medicare and Medicaid GDP Chart.png 960 × 720; 85 KB
-
Medicare Cost to GDP Comparison of 2009 and 2015 Trustee Forecasts.png 901 × 575; 149 KB
-
Monthly federal spending.webp 3,884 × 1,180; 27 KB
-
National debt of the United States.webp 4,442 × 2,272; 105 KB
-
PerCapitaInflationAdjustedDefenseSpending.PNG 1,224 × 566; 74 KB
-
Public & Total Debt percent GDP Chart.png 960 × 720; 16 KB
-
Real After Tax Income Changes 1979-2004.png 960 × 720; 79 KB
-
Reported Deficits vs. Debt Increases - 2007.png 960 × 720; 7 KB
-
Republican Proposal - Federal Spending as percent GDP.png 960 × 720; 178 KB
-
Revenue and Expense to GDP Chart 1993 - 2007.png 960 × 720; 9 KB
-
Revenue and Expense to GDP Chart 1993 - 2012.png 960 × 720; 12 KB
-
Revenue and Spending of the Federal Government.png 4,747 × 2,175; 266 KB
-
Sectoral Balances Using CBO Data 1992-2017.png 1,399 × 768; 169 KB
-
Sectoral Financial Balances in U.S. Economy.png 1,388 × 775; 146 KB
-
Sensible Priorities make a statement (1393855723).jpg 2,288 × 1,712; 980 KB
-
SNAP Benefits Paid 2005-2012.png 976 × 485; 40 KB
-
SNAP Program Participants.png 974 × 487; 39 KB
-
Support a Balanced Budget Amendment (Marlin Stutzman).png 600 × 600; 30 KB
-
Surplus and deficits 2021.png 1,548 × 865; 210 KB
-
Surplus-deficit and unemployment.png 1,168 × 470; 66 KB
-
Table 39 - Corporate welfare.JPG 634 × 385; 38 KB
-
TANF Program Spending.png 573 × 370; 15 KB
-
Tax Revenue - Category Pct to Total.png 1,280 × 720; 53 KB
-
Topsy-Turvy Budget Bus (1404435911).jpg 1,600 × 1,200; 474 KB
-
Topsy-Turvy Budget Bus Front (1404436553).jpg 1,600 × 1,200; 490 KB
-
Total Revenues and Outlays as Percent GDP 2013.png 1,025 × 484; 65 KB
-
Total Revenues and Outlays as Percent GDP 2014.png 1,060 × 520; 62 KB
-
Total Revenues and Outlays as Percent GDP 2016.png 859 × 418; 74 KB
-
Total Revenues and Outlays as Percent GDP 2017.png 1,108 × 579; 64 KB
-
Transfer payments as a percent of federal revenue.webp 5,470 × 2,970; 356 KB
-
Transfer payments to persons + business.webp 5,323 × 2,809; 365 KB
-
Trump economic variables- v1.png 1,360 × 762; 136 KB
-
U.S. Budget deficits - CBO Baseline vs. TCJA.png 1,280 × 720; 44 KB
-
U.S. Defense Spending - percent to Outlays.png 960 × 720; 10 KB
-
U.S. Defense Spending Trends 2001-2014.png 1,127 × 556; 37 KB
-
U.S. Defense Spending Trends.png 960 × 720; 8 KB
-
U.S. Discretionary spending from 1966 to 2015.png 835 × 585; 38 KB
-
U.S. Econonomic Trends 2014-2017 Nine Panel.png 1,265 × 733; 143 KB
-
U.S. Federal budget actual versus forecast 2000-2011.png 1,307 × 734; 95 KB
-
U.S. Federal Corporate Income Tax Receipts and Pre-Tax Profits.png 2,520 × 1,512; 193 KB
-
U.S. Federal Deficit Stacked Bar Chart - 2018 to 2027.png 1,280 × 720; 84 KB
-
U.S. federal government spending, 2010-2014.jpg 540 × 713; 153 KB
-
U.S. Federal Revenue Collection Forecasts 2018-2025.png 1,280 × 720; 52 KB
-
U.S. Federal Spending - FY 2009.png 960 × 720; 34 KB
-
U.S. Federal Spending - FY 2010.svg 960 × 720; 3 KB
-
U.S. Federal Spending - FY 2012.png 960 × 720; 27 KB
-
U.S. Federal Spending - FY 2013.png 960 × 720; 27 KB
-
U.S. Federal Spending - FY 2014.svg 800 × 600; 12 KB
-
U.S. Federal Spending - FY 2015.svg 800 × 600; 14 KB
-
U.S. Federal Spending - FY 2016.svg 800 × 600; 16 KB
-
U.S. Federal spending per capita, nominal and inflation adjusted.png 1,196 × 454; 41 KB
-
U.S. federal spending vs historical trendline.png 1,259 × 789; 111 KB
-
U.S. Federal Spending-Share of Mandatory vs. Discretionary Spending.png 1,280 × 720; 23 KB
-
U.S. Federal Spending.png 960 × 720; 117 KB
-
U.S. Federal Tax Receipts - FY 2011.png 960 × 720; 22 KB
-
U.S. healthcare coverage 2008-2026.png 877 × 795; 39 KB
-
U.S. Intragovernmental debt - v1.png 1,384 × 795; 138 KB
-
U.S. Mandatory and Discretionary Spending 1966 to 2015.png 1,102 × 533; 46 KB
-
U.S. National Debt - Dollars and Relative to GDP.png 1,280 × 720; 82 KB
-
U.S. National Debt Additions.png 960 × 720; 5 KB
-
U.S. research funding.png 1,140 × 686; 63 KB
-
U.S. Total Deficits vs. National Debt Increases 2001-2010 (hy).png 1,828 × 1,388; 150 KB
-
U.S. Total Deficits vs. National Debt Increases 2001-2010.png 914 × 694; 30 KB
-
United States Federal Government debt.webp 3,556 × 2,265; 88 KB
-
United States Federal Spending as a Percentage of GDP.png 1,024 × 768; 61 KB
-
US annual federal outlays 1901 to 2006 titles.svg 449 × 333; 70 KB
-
US budget 2007.svg 530 × 600; 8 KB
-
US Debt Held by Public.png 1,242 × 737; 100 KB
-
US Federal Budget Comparison 2016 vs. 2015.png 1,390 × 785; 322 KB
-
US Federal Budget Deficits as of Feb. 2023.png 488 × 276; 29 KB
-
US Federal Budget Deficits as of Sep. 2020.png 1,200 × 800; 59 KB
-
US Federal Debt Held By Public as of Feb. 2023.png 486 × 256; 17 KB
-
US Federal Debt Held By Public as of Sep. 2020.png 1,200 × 800; 59 KB
-
US Federal Outlay and GDP linear graph.png 600 × 381; 54 KB
-
US Federal Outlay and GDP linear graph.svg 849 × 537; 32 KB
-
Us gov spending 2005 billions.png 350 × 250; 4 KB
-
Us gov spending 2005 pct gdp.png 350 × 250; 3 KB
-
Us gov spending history 1902 2010.png 390 × 248; 9 KB
-
USA 2010 Military Budget Spending.jpg 600 × 463; 22 KB
-
WHO LEFT US WITH HUGE DEFICITS? (4328025067).jpg 1,134 × 824; 146 KB


