Category:Unemployment rates in the United States
Jump to navigation
Jump to search
Countries of the Americas: United States of America
Subcategories
This category has only the following subcategory.
Media in category "Unemployment rates in the United States"
The following 62 files are in this category, out of 62 total.
-
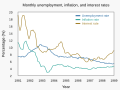 1981–1989 monthly unemployment, inflation, and interest rates.svg 1,000 × 750; 7 KB
-
 Annual rate of change of unemployment rate under various US Presidents.tif 4,082 × 2,089; 289 KB
-
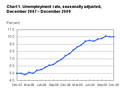
 ARRA Unemployment Rate Graph 2011-05.jpg 828 × 510; 54 KB
-
 Black and white unemployment rates.jpg 400 × 285; 22 KB
-
 Chomage-oecd-t3-2009.png 877 × 576; 1.45 MB
-
 Civilian unemployment rate during Reagan presidency.png 1,168 × 620; 48 KB
-
 Cleveland msa unemployment rate.png 350 × 232; 45 KB
-
 Clinton econ panel v1.png 1,311 × 738; 203 KB
-
 Courbe de Philips 1960.jpg 715 × 555; 20 KB
-
 Empsit Page 01.png 545 × 430; 13 KB
-
 Entwicklung Arbeitslosenquote.svg 496 × 290; 117 KB
-
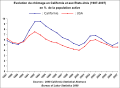 Evol chomage Ca USA 1987-2007.svg 607 × 447; 118 KB
-
 Evolution chomage USA 1948-2008.svg 533 × 368; 104 KB
-
 Fundamentals of Business - Fig. 2.6 - The United States Unemployment Rate.jpg 2,205 × 2,043; 257 KB
-
 GraphUnemploymentThroughPresidents.png 1,542 × 852; 82 KB
-
 IntVerglArblos.PNG 970 × 604; 31 KB
-
 Mecklenburg county unemployment.png 394 × 332; 511 KB
-
 Monthly job numbers and unemployment.png 7,013 × 7,832; 1.29 MB
-
 Ohio vs US unemployment 1976-2022.png 1,168 × 450; 84 KB
-
 Okuns law quarterly differences.svg 301 × 199; 90 KB
-
 Philips60.png 1,123 × 794; 27 KB
-
 Philipsus60.png 1,123 × 794; 26 KB
-
 Quits rate vs unemployment rate.png 1,426 × 478; 105 KB
-
 Surplus-deficit and unemployment.png 1,168 × 470; 66 KB
-
 Taux de chômage aux États-Unis dans les années 1990.svg 485 × 290; 12 KB
-
 U.S. economic variables during President Obama's tenure.png 1,318 × 768; 210 KB
-
 U.S. Unemployment Rate by Education Level.png 1,168 × 450; 78 KB
-
 Unemployment and employment statistics for the US since 2000.png 1,271 × 563; 60 KB
-
 Unemployment in the U.S. During the Great Depression.gif 504 × 253; 7 KB
-
 Unemployment rate in Greater Lowell, 1990-2011.png 1,038 × 423; 57 KB
-
 Unemployment rate United states - Europe 1993-2013.png 578 × 501; 24 KB
-
 Unemployment to wages.png 1,250 × 415; 138 KB
-
 Unemployment-rate-before-after-1996-welfare-reform.png 718 × 696; 29 KB
-
 United States unemployment with incarceration 1892-2016.png 655 × 353; 77 KB
-
 Urate48-04.jpg 480 × 257; 30 KB
-
 US annual unemployment rate.svg 750 × 440; 18 KB
-
 US average duration of unemployment.png 970 × 604; 22 KB
-
 US Employment Statistics - March 2015.png 1,388 × 789; 135 KB
-
 US Employment Statistics from FRED Database - v1.png 1,130 × 822; 89 KB
-
 US Employment Statistics.svg 800 × 480; 22 KB
-
 US Employment Statisticsm (hy).png 4,445 × 2,667; 270 KB
-
 US EmpStatsBLS Jan09-Aug13.png 894 × 579; 38 KB
-
 US EmpStatsBLS Jan09-Feb13.png 723 × 497; 29 KB
-
 US EmpStatsBLS Jan09-Oct12.PNG 786 × 461; 28 KB
-
 US EmpStatsBLS Jan09-Sept12.PNG 714 × 430; 26 KB
-
 US Seasonal Unemployment.svg 720 × 540; 150 KB
-
 US Unemployment 1800-1890.gif 628 × 398; 12 KB
-
 US Unemployment 1890-2009.gif 796 × 416; 24 KB
-
 US Unemployment 1890-2011.gif 796 × 416; 25 KB
-
 US Unemployment 1910-1960.gif 620 × 410; 12 KB
-
 US Unemployment from 1910-1960.svg 512 × 339; 11 KB
-
 US Unemployment measures.svg 720 × 540; 154 KB
-
 US unemployment rate U3 from 1970.png 970 × 604; 21 KB
-
 US unemployment rate U3 U6.png 970 × 604; 26 KB
-
 US unemployment rate under President Obama (test file).svg 750 × 440; 10 KB
-
 US unemployment rate under President Obama.svg 750 × 440; 82 KB
-
 US unemployment rate.svg 750 × 440; 42 KB
-
 Us unemployment rates 1950 2005.png 838 × 549; 36 KB
-
 Us unemployment rates 1950 2005.svg 683 × 465; 159 KB
-
 US Unemployment Rates 1980s.png 986 × 623; 24 KB
-
 US unemployment rates U3 and U6.png 1,380 × 796; 204 KB
-
 USA-Arbeitslosigkeit.svg 720 × 540; 88 KB


.png)


.svg)


