Category:Transmission lines
Jump to navigation
Jump to search
English: In communications and en:electronic engineering, a transmission line is a specialized cable or other structure designed to carry alternating current of radio frequency, that is, currents with a frequency high enough that their wave nature must be taken into account. Transmission lines are used for purposes such as connecting radio transmitters and receivers with their antennas, distributing cable television signals, trunklines routing calls between telephone switching centres, computer network connections and high speed computer data buses.
specialized cable or other structure designed to carry alternating current of radio frequency | |||||
| Upload media | |||||
| Instance of |
| ||||
|---|---|---|---|---|---|
| Subclass of |
| ||||
| |||||
- For the electric power transmission line, see Category:Electric power transmission
- For the feed line that connects the antenna with the radio transmitter or receiver, see Category:Transmission lines (radio)
Subcategories
This category has the following 14 subcategories, out of 14 total.
A
- Air stripline (2 F)
B
C
D
- Distributed element filters (11 F)
L
- Lecher lines (16 F)
M
- Microstrip (56 F)
S
- Smith charts (33 F)
T
- Transmission parameters (1 F)
W
Media in category "Transmission lines"
The following 200 files are in this category, out of 235 total.
(previous page) (next page)-
Air bridge.svg 27 × 9; 8 KB
-
Artificial Telephone Line 6000ft, 24 gauge, Schematic.png 3,000 × 1,800; 103 KB
-
Artificial transmission-line-media-tif.tif 1,024 × 569; 2.24 MB
-
Artificial transmission-line-media.png 1,024 × 569; 61 KB
-
Balansoitu kytkentä.jpg 548 × 329; 61 KB
-
Bergeron Diagram time equal 0 Ge.svg 916 × 593; 29 KB
-
Bergeron Diagram time equal 1 Ge.svg 916 × 593; 30 KB
-
Bergeron Diagram time equal 2 Ge.svg 916 × 593; 32 KB
-
Bergeron Diagram time infinite Ge.svg 916 × 593; 34 KB
-
Bergeron Diagram time less then 0 Ge.svg 916 × 593; 21 KB
-
Bergeron Diagram TTL Ge.svg 916 × 593; 44 KB
-
Bergeron Timing TTL Ge.svg 916 × 593; 13 KB
-
Blumlein transmission line animation.gif 722 × 506; 80 KB
-
Calculation of transmission line propagation constant.svg 1,035 × 361; 64 KB
-
Characteristic Impedance power attenuation.svg 371 × 415; 18 KB
-
Charge line animation.gif 627 × 416; 57 KB
-
Circuito lettura sincrona.png 296 × 164; 2 KB
-
Circuito scrittura asincrona.png 356 × 181; 2 KB
-
Circuito scrittura semisincrona.png 365 × 178; 2 KB
-
Circuito scrittura sincrona.png 298 × 164; 2 KB
-
Coplanar variants.svg 1,252 × 182; 8 KB
-
Coplanar waveguide structure.svg 965 × 274; 14 KB
-
Crosstalk models.png 1,000 × 620; 80 KB
-
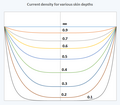
Current Density in Round Wire for Variuos Skin Depths.png 703 × 616; 56 KB
-
Devers-Valley SCE Transmission Line Path.tif 530 × 238; 137 KB
-
Diagramma temporale lettura asincrona.png 424 × 410; 3 KB
-
Diagramma temporale lettura sincrona.png 414 × 392; 3 KB
-
Diagramma temporale scrittura asincrona.png 479 × 476; 5 KB
-
Diagramma temporale scrittura sincrona.png 307 × 335; 3 KB
-
Dielectric line variants.svg 1,351 × 182; 10 KB
-
Diplexer2 - 2.png 480 × 250; 3 KB
-
Diplexer2.png 300 × 270; 4 KB
-
Discontinuity on transmission line.svg 1,503 × 340; 34 KB
-
Distributed-parameter interconnect model.png 598 × 119; 2 KB
-
Duplexer1.png 460 × 340; 5 KB
-
E3456ase1123.jpg 530 × 219; 12 KB
-
Ecuaciones.jpg 318 × 78; 36 KB
-
Electric and Magnetic Field of Wire Cross-Section.svg 512 × 410; 3 KB
-
Electric and Magnetic Fields for Microstrip.svg 512 × 410; 5 KB
-
Enter-guri-appartments.jpg 442 × 626; 33 KB
-
Equivalent generator and line.svg 700 × 275; 23 KB
-
Equivalent incident wave and load.svg 700 × 275; 26 KB
-
Equivalent Sub Circuit of a Balanced Tarnsmission Line.jpg 3,001 × 1,801; 879 KB
-
Eversource Transmission Lines in Connecticut.jpg 5,184 × 3,456; 6.46 MB
-
Ferranti Cable Schema.svg 600 × 170; 4 KB
-
Ferranti Cable Vector.svg 600 × 210; 2 KB
-
Feuchtigkeitserkennung in Gebäuden mit TDR.png 1,432 × 900; 203 KB
-
Fields for a Twin-Lead Line.svg 512 × 512; 5 KB
-
Fields for Half a Twin-Lead Line.svg 512 × 410; 5 KB
-
Finline structure.svg 759 × 444; 16 KB
-
Finline variants.svg 1,511 × 279; 7 KB
-
FRB1.jpg 640 × 480; 27 KB
-
Gaussian Pulse in Transmission Line.png 6,601 × 5,101; 1.01 MB
-
Gaussian Pulse.png 6,000 × 3,600; 251 KB
-
Goubau.gif 1,314 × 766; 12 KB
-
High voltage transmission towers - Polder Stein - Haastrecht (25374398535).jpg 4,110 × 3,083; 14.04 MB
-
High-voltage power line.jpg 1,024 × 659; 320 KB
-
Homogenni vedeni.png 576 × 299; 4 KB
-
Ideal interconnect model.png 320 × 134; 1 KB
-
Imageline structure.svg 965 × 274; 1 KB
-
Interior caja.gif 186 × 508; 4 KB
-
Isolierende Viertelwellenstütze.png 578 × 354; 39 KB
-
IvanpahControlProject2019.jpg 3,264 × 2,448; 1.78 MB
-
IWS bus connection topology.png 406 × 160; 2 KB
-
IWS circuit.png 406 × 160; 2 KB
-
IWS ringing.png 235 × 197; 1 KB
-
IWS time diagram.png 253 × 197; 1 KB
-
Left handed line.svg 185 × 109; 17 KB
-
Leidingelementen.jpg 578 × 152; 5 KB
-
Leitungsbelag.svg 500 × 250; 17 KB
-
Leitungsmodell.svg 290 × 230; 8 KB
-
Leitungswellenwiderstand ueber Frequenz.svg 700 × 520; 39 KB
-
Line equivalent circuit for Zo.svg 603 × 361; 24 KB
-
Line model general impedances.svg 935 × 361; 38 KB
-
Linea di trasmissione.PNG 505 × 212; 8 KB
-
Linea in continua a sbalzo.png 866 × 545; 7 KB
-
Linea monofase a sbalzo piu carichi.png 866 × 545; 9 KB
-
Linha Transmissao DSCN5227.jpg 4,608 × 2,592; 2.5 MB
-
Linha Transmissao DSCN5243.jpg 4,608 × 2,592; 2.66 MB
-
Linia dluga schemat zastepczy.svg 570 × 220; 18 KB
-
Linia rozwarta na koncu.jpg 600 × 616; 54 KB
-
Linia zwarta na końcu.jpg 600 × 640; 54 KB
-
LMatchingNetworks.svg 542 × 300; 24 KB
-
Lumped interconnect model 2.png 389 × 126; 1 KB
-
Lumped interconnect model 3.png 288 × 116; 1 KB
-
Längs und Querspannungsabfall.svg 450 × 430; 46 KB
-
Method PaRi 1a.jpg 1,711 × 906; 163 KB
-
Method PaRi 1b.jpg 1,721 × 904; 130 KB
-
Method PaRi 1c.jpg 1,721 × 906; 184 KB
-
Microstrip variants.svg 1,113 × 182; 11 KB
-
Mikropasik.PNG 179 × 181; 4 KB
-
Mismatched transmission line.svg 1,503 × 340; 50 KB
-
Mitered stripline cutoff scheme.svg 156 × 121; 14 KB
-
Modello di interconnessione concentrato 1.png 378 × 144; 2 KB
-
Moisture Detection in Buildings with TDR.png 1,596 × 960; 215 KB
-
MRS time diagram.png 253 × 236; 2 KB
-
Newfoundland-Azores 1928 Submarine Telegraph Cable Estimated Velocity vs Frequency.png 2,771 × 1,931; 204 KB
-
NGCP-Pole-number-(Created in Microsoft Paint).jpg 71 × 230; 11 KB
-
Nicht abgeschl Leitung.gif 787 × 661; 14 KB
-
Niesymetryczna linia paskowa.jpg 500 × 159; 14 KB
-
Niesymetryczna linia paskowa.svg 570 × 220; 29 KB
-
NYW-TelegraphEquations.png 1,094 × 505; 32 KB
-
NYW-TransmissionLine.png 1,002 × 451; 13 KB
-
Obciazenie indukcyjne.jpg 600 × 218; 22 KB
-
Obciazenie pojemnosciowe.jpg 600 × 218; 22 KB
-
Obciazenie rezystancyjne.jpg 600 × 505; 45 KB
-
Ortskurve der Fortpflanzungskonstante.svg 319 × 929; 18 KB
-
Ortskurve des Leitungswellenwiderstandes.svg 806 × 286; 17 KB
-
Overhead Transmission Lines.jpg 5,472 × 3,648; 985 KB
-
Planar circuit gallery.svg 670 × 298; 42 KB
-
Planar transitions.svg 438 × 286; 44 KB
-
PolarSmith.jpg 1,018 × 1,064; 113 KB
-
Powerline Tower in Occoneechee Mountain State Natural Area.jpg 2,448 × 3,264; 3.6 MB
-
Reflex kurz.png 501 × 356; 7 KB
-
Reflex offen.png 500 × 356; 7 KB
-
RelocatedSteelPole236HermosaDuhatBalintawakLineSticker.jpg 53 × 185; 4 KB
-
RelocatedSteelPole263HermosaDuhatBalintawakLineSticker.png 52 × 187; 20 KB
-
Resistance of an annular ring.png 2,100 × 1,800; 203 KB
-
Right handed line.svg 185 × 109; 24 KB
-
RS485 Leitung.jpg 472 × 134; 5 KB
-
RWS circuit.png 363 × 185; 2 KB
-
RWS time diagram.png 253 × 197; 1 KB
-
Segments.jpg 2,585 × 867; 201 KB
-
Shielded Parallel Plate Transmission Line Cross Section.png 3,001 × 1,351; 101 KB
-
Short line voltage phasor diagrams.png 1,418 × 414; 127 KB
-
Signal flow graph for transmission line.jpg 4,876 × 3,751; 1.63 MB
-
Signal over transmission line.png 363 × 160; 2 KB
-
Signal01.jpg 617 × 398; 21 KB
-
Signal02.jpg 614 × 397; 27 KB
-
Signal03.jpg 615 × 395; 30 KB
-
Signal04.jpg 611 × 393; 28 KB
-
Signal05.jpg 617 × 395; 24 KB
-
Signal06.jpg 613 × 394; 26 KB
-
SIW structure.svg 965 × 274; 60 KB
-
Slotline structure.svg 965 × 274; 14 KB
-
Slotline variants.svg 979 × 182; 9 KB
-
Smith chart explanation.svg 2,666 × 1,798; 1.49 MB
-
SmithChartLineLength.svg 2,374 × 1,304; 662 KB
-
Sob a torre.jpg 5,760 × 3,840; 1.54 MB
-
Soft pre emphasis in digital communications systems.png 629 × 388; 20 KB
-
Solutions of Telegrapher's Equations as Circuit Components.jpg 1,477 × 808; 264 KB
-
Space diagram signal over transmission line.png 391 × 582; 3 KB
-
Speaker impedance.svg 1,224 × 630; 21 KB
-
Standing wave nulls.svg 730 × 470; 49 KB
-
Standing Wave Ratio.svg 720 × 460; 67 KB
-
Standing wave SWR 1 (forward, reflected).gif 434 × 186; 129 KB
-
Standing wave SWR 1 (traveling, standing).gif 434 × 186; 129 KB
-
Standing wave SWR 1.5 (forward, reflected) open.gif 434 × 186; 180 KB
-
Standing wave SWR 1.5 (forward, reflected).gif 434 × 186; 186 KB
-
Standing wave SWR 1.5 (traveling, standing) open.gif 434 × 186; 177 KB
-
Standing wave SWR 1.5 (traveling, standing).gif 434 × 186; 183 KB
-
Standing wave SWR 2.33 (forward, reflected) open.gif 434 × 186; 204 KB
-
Standing wave SWR 2.33 (forward, reflected).gif 434 × 186; 214 KB
-
Standing wave SWR 2.33 (traveling, standing) open.gif 434 × 186; 196 KB
-
Standing wave SWR 2.33 (traveling, standing).gif 434 × 186; 207 KB
-
Standing wave SWR 4 (forward, reflected) open.gif 434 × 186; 224 KB
-
Standing wave SWR 4 (forward, reflected).gif 434 × 186; 228 KB
-
Standing wave SWR 4 (traveling, standing) open.gif 434 × 186; 209 KB
-
Standing wave SWR 4 (traveling, standing).gif 434 × 186; 218 KB
-
Standing wave SWR 9 (forward, reflected) open.gif 434 × 186; 243 KB
-
Standing wave SWR 9 (forward, reflected).gif 434 × 186; 215 KB
-
Standing wave SWR 9 (traveling, standing) open.gif 434 × 186; 213 KB
-
Standing wave SWR 9 (traveling, standing).gif 434 × 186; 201 KB
-
Standing wave SWR fr m02.gif 432 × 180; 160 KB
-
Standing wave SWR fr m04.gif 432 × 180; 189 KB
-
Standing wave SWR fr m06.gif 432 × 180; 213 KB
-
Standing wave SWR fr m08.gif 432 × 180; 235 KB
-
Standing wave SWR fr p00.gif 432 × 180; 109 KB
-
Standing wave SWR fr p02.gif 432 × 180; 160 KB
-
Standing wave SWR fr p04.gif 432 × 180; 189 KB
-
Standing wave SWR fr p06.gif 432 × 180; 213 KB
-
Standing wave SWR fr p08.gif 432 × 180; 236 KB
-
Standing wave SWR ts m02.gif 432 × 180; 159 KB
-
Standing wave SWR ts m04.gif 432 × 180; 181 KB
-
Standing wave SWR ts m06.gif 432 × 180; 197 KB
-
Standing wave SWR ts p00.gif 432 × 180; 109 KB
-
Standing wave SWR ts p02.gif 432 × 180; 159 KB
-
Standing wave SWR ts p04.gif 432 × 180; 181 KB
-
Standing wave SWR ts p06.gif 432 × 180; 196 KB
-
Standing wave SWR ts p08.gif 432 × 180; 204 KB
-
Step disturbance on transmission line.svg 848 × 592; 52 KB
-
Stripline structure.svg 833 × 357; 39 KB
-
Stripline variants.svg 889 × 182; 11 KB
-
Structure for Bergeron Diagram Ge.svg 900 × 300; 4 KB
-
Suspended stripline structure.svg 965 × 274; 12 KB
-
SWR-m-08.gif 435 × 343; 517 KB
-
SWRmeter.png 677 × 343; 2 KB
-
T line img.jpg 1,049 × 427; 26 KB
-
T line img2.jpg 1,143 × 518; 31 KB
-
T line img3.jpg 1,187 × 467; 37 KB
-
T-pylons.webp 5,092 × 2,432; 82 KB
-
Tarnsmission Line Equivalent Sub Circuit.jpg 3,001 × 1,801; 665 KB
-
TDR of several twisted pairs of telephone cable.png 1,244 × 795; 204 KB
-
TDR-Waveguide Moisture Measurement.jpg 3,264 × 2,448; 1.89 MB
-
Time diagram signal over transmission line.png 167 × 119; 670 bytes
-
Timing from Bergeron Diagram Ge.svg 916 × 593; 28 KB
-
Transmission line 4 port.svg 350 × 90; 13 KB


