Category:The climate and weather of Australia (book)
Jump to navigation
Jump to search
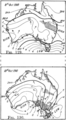
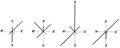
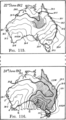
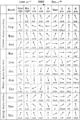
Images from the book "The climate and weather of Australia" published 1913 by Henry Ambrose Hunt.
Media in category "The climate and weather of Australia (book)"
The following 71 files are in this category, out of 71 total.
-
 ANTARCTIC CYCLONE—Passing over Inland Victoria, with general rains.png 1,084 × 1,976; 478 KB
-
 ANTARCTIC Cyclone—Passing through Bass Strait.png 1,087 × 2,164; 443 KB
-
 ANTARCTIC DEPRESSION—Unfavorable to Inland Rains No Tropical connection.png 1,084 × 875; 196 KB
-

-

-
 ANTICYCLONE FORCED SOUTHWARD OVER TASMANIA BY CYCLONE OFF NEW SOUTH WALES COAST.png 1,095 × 1,976; 556 KB
-
 AVENEL TORNADO (VICTORIA).png 1,084 × 1,975; 402 KB
-
 Average Monthly Paths of Anticyclones January-June 1910 Fig 32.png 2,491 × 1,685; 223 KB
-
 Average Monthly Paths of Anticyclones July-December 1910 Fig 33.png 2,498 × 1,724; 243 KB
-
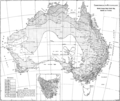
 Average Yearly Temperature Australia and Tasmania Fig 13.png 3,068 × 2,414; 7.44 MB
-

-
 Charts Showing Humidity, also Wet and Dry Bulb Isotherms Fig 53-54.png 2,526 × 3,941; 327 KB
-
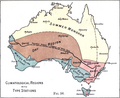 Climatological Regions with Type Stations Fig 58.png 2,938 × 2,398; 4.5 MB
-
 COLD SNAP, SOUTH-EAST AUSTRALIA.png 1,086 × 1,976; 472 KB
-

-
 DEVELOPMENT OF MONSOONAL TROUGH.png 1,083 × 1,967; 488 KB
-
 Direction of Rain Winds Fig 75.png 2,175 × 869; 79 KB
-
 DUST STORMS Fig 148-150.png 3,423 × 885; 617 KB
-
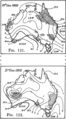
 EAST COAST CYCLONE OF ANTARCTIC ORIGIN Fig 137-139.png 3,447 × 889; 606 KB
-
 EAST COAST CYCLONE OF INLAND ORIGIN Fig 140-141.png 2,264 × 881; 385 KB
-
 EAST COAST CYCLONE OF OCEANIC ORIGIN.png 1,125 × 1,955; 431 KB
-
 EASTERLY GALES THROUGH BASS STRAIT.png 1,081 × 1,973; 455 KB
-
 Fig 89-90.png 2,214 × 4,035; 932 KB
-
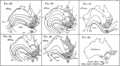
 Fiji Hurricane March 1910 Fig 93-96.png 2,393 × 2,769; 1.12 MB
-
 Flood Rains Fig 77-82.png 2,385 × 3,069; 650 KB
-
 FLOOD RAINS IN SOUTH EAST AUSTRALIA Fig 76.png 2,893 × 2,172; 1.11 MB
-
 FOGS IN MELBOURNE Fig 151-153.png 3,434 × 870; 666 KB
-

-

-
 Hunt - The climate and weather of Australia - 1913.djvu 2,788 × 4,634, 178 pages; 6.94 MB
-
 INLAND WINTER RAINS—Of Tropical origin and Cyclonic ending.png 1,089 × 1,985; 527 KB
-
 ISOBARIC CHARTS CHARACTERISTIC OF DROUGHT YEARS Fig 60-65.png 2,381 × 3,089; 787 KB
-
 LAND & SEA BREEZES AT ADELAIDE Fig 37.png 2,348 × 3,521; 663 KB
-
 LAND & SEA BREEZES AT PERTH Fig 36.png 2,351 × 3,513; 910 KB
-

-
 Map showing regions of maximum monthly rainfall Fig 51.png 3,379 × 2,421; 4.4 MB
-
 MARONG TORNADO (VICTORIA).png 1,074 × 1,964; 443 KB
-
 Mean Isobars Annual Fig 27.png 3,056 × 2,372; 1.96 MB
-
 Mean Monthly Isobars Fig 15-20.png 3,819 × 1,991; 2.08 MB
-
 Mean Monthly Isobars Fig 21-26.png 3,801 × 2,002; 2.82 MB
-
 Mean Monthly Rainfall Fig 39-44.png 3,881 × 2,377; 1.69 MB
-
 Mean Monthly Rainfall Fig 45-50.png 3,851 × 2,349; 1.53 MB
-
 Mean Monthly Temperature and Rainfall of the Australian Capitals.png 3,849 × 2,249; 1.81 MB
-
 Mean Monthly Temperature Fig 1-6.png 3,847 × 2,132; 8.92 MB
-
 Mean Monthly Temperature Fig 7-12.png 3,881 × 2,140; 9.83 MB
-
 Mean Pressure April 1910 Fig 29.png 2,425 × 1,858; 391 KB
-
 Mean Pressure December 1910-A type of Midsummer Distribution Fig 31.png 2,457 × 1,924; 142 KB
-
 Mean Pressure July 1910-A type of Midwinter Distribution Fig 30.png 2,458 × 1,901; 230 KB
-
 PROLONGED HOT SPELLS-SOUTH-EASTERN AUSTRALIA Fig 131-136.png 3,754 × 1,958; 1.12 MB
-
 Queensland Hurricane Fig 97-98.png 2,153 × 2,869; 577 KB
-
 Revised Average Annual Rainfall Map Australia and Tasmania Fig 38.png 2,846 × 2,388; 1.12 MB
-
 Southerly Bursters Fig 99-100.png 1,532 × 2,581; 472 KB
-
 SUMMER ANTICYCLONE.png 1,071 × 882; 240 KB
-
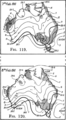
 SUMMER MONSOONAL RAINS-NORTHERN AUSTRALIA Fig 110-112.png 3,394 × 878; 747 KB
-
 Tabulated Diagram Page 26.png 2,233 × 645; 104 KB
-
 TENDENCY TO ISOBARIC DISTRIBUTION NOTICEABLE IN DRY SPRINGS Fig 66-67.png 2,374 × 935; 226 KB
-
 TENDENCY TO ISOBARIC DISTRIBUTION NOTICEABLE IN DRY SPRINGS Fig 68-69.png 2,375 × 938; 265 KB
-
 TENDENCY TO ISOBARIC DISTRIBUTION NOTICEABLE IN DRY SPRINGS Fig 70-71.png 2,361 × 918; 267 KB
-
 The Relation of Contour to Rainfall Fig 56.png 2,464 × 2,367; 1.97 MB
-
 TORNADO-LIKE WINDSTORMS PRECEDING THE GEMVILLE TORNADO.png 1,084 × 1,971; 556 KB
-
 Tracks of Lows January-June 1910 Fig 34.png 2,501 × 1,773; 293 KB
-
 Tracks of Lows July-December 1910 Fig 35.png 2,497 × 1,769; 259 KB
-
 TROPICAL CYCLONE NORTH QUEENSLAND.png 1,095 × 1,964; 483 KB
-
 TROPICAL RAINSTORM—Moving from the Territory Southward into South Australia.png 1,074 × 1,970; 491 KB
-
 TYPICAL RAIN-PRODUCING STORM SYSTEMS Fig 72-74.png 2,228 × 3,773; 758 KB
-
 Typical willy-willy disturbance Fig 91-92.png 1,714 × 2,181; 398 KB
-
 Weather Charts-Floods of January 1910 Fig 83-88.png 3,754 × 2,078; 1.15 MB
-
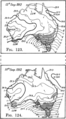 WESTERLY GALES THROUGH BASS STRAIT Fig 123-124.png 1,081 × 1,950; 489 KB
-
 WILLY WILLY MOVING INLAND Fig 121-122.png 1,084 × 1,961; 496 KB
-
 WILLY WILLY RETURNING OCEANWARDS Fig 119-120.png 1,075 × 1,952; 519 KB
-
 WINTER ANTICYCLONE.png 1,074 × 878; 189 KB


.png)


.png)


