Category:Temperature diagrams
Jump to navigation
Jump to search
Subcategories
This category has the following 5 subcategories, out of 5 total.
Media in category "Temperature diagrams"
The following 136 files are in this category, out of 136 total.
-
-3 graus Celcius - Castelo Neuschwanstain - Fussen - Alemanha (8746377640).jpg 1,600 × 1,067; 929 KB
-
1951+ Percent of global area at temperature records - Seasonal comparison - NOAA.svg 2,000 × 1,400; 22 KB
-
1951- Percent of record temperatures that are cold or warm records.svg 1,000 × 700; 8 KB
-
1951- Warm and cold record temperatures - bar chart.svg 1,000 × 700; 6 KB
-
2013 POCASIHL.png 2,889 × 3,289; 455 KB
-
2013 Počasí Hroznová Lhota.svg 1,800 × 2,000; 196 KB
-
20210822 Global warming - warming stripes bar chart.svg 1,000 × 750; 14 KB
-
Annual Mean Temperature Change for Land and for Ocean NASA GISTEMP 2017 October.png 1,500 × 1,235; 297 KB
-
Basaltemperaturkurve.png 1,031 × 265; 24 KB
-
Beide Temperaturen.png 972 × 519; 40 KB
-
Blackbodyvisiblerp.png 710 × 424; 6 KB
-
Canadian mining journal July-December 1915 (1915) (14802659263).jpg 2,012 × 3,526; 709 KB
-
Carnotcycle.jpg 1,104 × 807; 66 KB
-
CET 1659 - 2014 using Hadley Centre Data.png 696 × 473; 69 KB
-
Clima Venado.jpg 777 × 532; 82 KB
-
Comparison of temperature scales (1).png 1,096 × 722; 67 KB
-
Comparison of temperature scales blank.svg 845 × 580; 5 KB
-
Comparison of temperature scales.svg 1,096 × 722; 29 KB
-
Data availability and continuity matrix for GHCN with selected countries shaded.png 1,560 × 13,418; 318 KB
-
Diagram of Antiferromagnetic Magnetic Moments.png 640 × 400; 8 KB
-
Diagram of Ferrimagnetic Magnetic Moments.png 640 × 400; 10 KB
-
Diagramme climatique-Douglas.png 1,024 × 713; 115 KB
-
Eclipse-20.03.2015-warsaw.png 440 × 460; 37 KB
-
Effects on extreme temperatures.png 600 × 989; 60 KB
-
Escalas de Temperatura.jpg 300 × 294; 15 KB
-
Extreme temperature in Italy.jpg 1,414 × 1,421; 342 KB
-
Gases kelvin.png 567 × 378; 12 KB
-
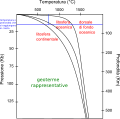
Geoterme.svg 689 × 681; 215 KB
-
Global surface temperature bar chart-vi.svg 1,000 × 750; 8 KB
-
Global temperature anomaly.jpg 2,996 × 1,119; 616 KB
-
Global Temperature Series 1978-2009.jpg 1,085 × 710; 180 KB
-
Global-monthly-temp-anomaly.png 3,400 × 2,400; 857 KB
-
Graph Greenland.png 1,098 × 654; 58 KB
-
Grierson 158 Cuadro térmico.jpg 1,553 × 885; 621 KB
-
Heat of Combustion.png 600 × 463; 17 KB
-
Human area projection factor.png 8,504 × 8,504; 404 KB
-
Human Body Temperature Scale.jpg 483 × 356; 31 KB
-
Influence de la température en enrobage.gif 960 × 720; 17 KB
-
Jezero Crater Daily Temperature Curv.jpg 629 × 629; 143 KB
-
Ladakhtemp.GIF 911 × 623; 14 KB
-
Ladakhtemp.png 1,200 × 900; 24 KB
-
Ladakhtemp2.svg 1,052 × 850; 40 KB
-
LaNature1873 Temperatures Ete.png 708 × 543; 22 KB
-
MarsTemperatureCuriosityRus.jpg 1,599 × 1,069; 489 KB
-
Maximae temperaturae in Portorico.png 1,164 × 610; 29 KB
-
MaxTemps PR.png 1,164 × 610; 30 KB
-
Melting temperature on DSC curve.PNG 592 × 379; 13 KB
-
Meteorology; a chart of air pressure and temperature at Manc Wellcome V0025063.jpg 3,500 × 2,022; 3.75 MB
-
Meyers b11 s0413 b1.png 1,149 × 340; 119 KB
-
Meyers b11 s0415 b1.png 304 × 471; 32 KB
-
Minimae temperaturae in Portorico.png 1,156 × 604; 30 KB
-
MinTemps PR.png 1,156 × 604; 31 KB
-
MudancadaTemperaturacomaLatitude.PNG 791 × 514; 22 KB
-
NASA-GISTEMP-Hemispheres.jpg 3,000 × 2,320; 420 KB
-
NASA-GISTEMP-Hemispheres.svg 725 × 480; 86 KB
-
NegativeTemperature-SvsE.svg 764 × 580; 38 KB
-
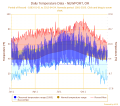
Newport-or-temperature-1893.svg 604 × 533; 215 KB
-
No se.png 836 × 600; 120 KB
-
Nunavut-Eureka-2009Jul14-temperatures.png 451 × 331; 10 KB
-
Ontwikkelingkoeler.jpg 1,227 × 854; 109 KB
-
Parasite150045-fig4 Dog with Trypanosoma congolense.png 1,308 × 767; 27 KB
-
PIA16913-MarsCuriosityRover-SteadyTemperature-GaleCrater.jpg 700 × 534; 74 KB
-
PSM V22 D662 1 Relationship between temperature and humidity.png 1,684 × 538; 129 KB
-
PSM V22 D662 2 Relationship between temperature and humidity.png 1,695 × 533; 128 KB
-
Range of estimated temperature profiles of the Moon's interior.png 1,234 × 682; 79 KB
-
Rss-msu-tmt-1979-2004.png 592 × 447; 7 KB
-
Sat-sfc-temps.png 740 × 540; 11 KB
-
Satellite temperature record.svg 454 × 324; 231 KB
-
Siedepunkt.svg 280 × 220; 37 KB
-
Skewed graph.jpg 1,512 × 982; 80 KB
-
Solar Angle of Incidence on Earth.png 500 × 354; 96 KB
-
Sun Atmosphere Temperature and Density SkyLab.jpg 877 × 1,246; 542 KB
-
Symmetric histogram.jpg 1,819 × 1,118; 130 KB
-
Temp 2.jpg 3,230 × 2,248; 1.14 MB
-
Temp lapaz.jpg 483 × 291; 28 KB
-
Temperaturabwichung.png 750 × 449; 23 KB
-
Temperaturas 4.jpg 1,123 × 782; 697 KB
-
Temperaturas 5.jpg 843 × 587; 653 KB
-
Temperaturas 6.jpg 675 × 470; 624 KB
-
Temperaturas.jpg 2,246 × 1,563; 910 KB
-
Temperature Bar Chart North America-Canada-Saskatchewan-1901-2020--2021-07-13.png 3,780 × 2,126; 65 KB
-
Temperature Phase Changes.jpg 635 × 419; 9 KB
-
Temperature profile of a product in a computer-controlled oven1.png 813 × 548; 18 KB
-
Temperature profile of a product in a computer-controlled oven2.png 805 × 515; 24 KB
-
Temperature zone of earth.jpg 2,560 × 1,920; 912 KB
-
Temperature-Scale diagram.jpg 800 × 494; 32 KB
-
Temperaturen2010.png 1,201 × 487; 44 KB
-
Temperatures predites surface cratere Gusev sur Mars.jpg 2,127 × 1,506; 238 KB
-
Temperaturkalibrierung Thermische Analyse.png 960 × 567; 8 KB
-
Temperaturzeitreihe Deutschland, 30 und 10 jährig.PNG 1,263 × 927; 91 KB
-
Temperaure Anomalies by Country - Years 1880-2017.webm 37 s, 1,920 × 1,080; 3.78 MB
-
Tempredh2.jpg 960 × 720; 114 KB
-
TempTallahassee.jpg 777 × 350; 63 KB
-
TempVarna.png 716 × 612; 46 KB
-
Température théorique des planètes.jpg 1,119 × 539; 100 KB
-
Teplota a úrazovost (2).jpg 814 × 690; 70 KB
-
The working of Thermostat for cooling.png 635 × 235; 13 KB
-
ThermostatWorksForCooling.svg 960 × 540; 82 KB
-
TNx, Istanbul.png 800 × 600; 72 KB
-
Uranian stratosphere.png 1,194 × 1,616; 32 KB
-
US66 temperature profile.jpg 1,542 × 1,253; 114 KB
-
Vergelijking van temperatuurschalen.svg 1,096 × 722; 24 KB
-
Vostok co2 temp CO2 150000 to 80000 print.jpg 1,060 × 690; 72 KB
-
Vostok co2 temp CO2 245000 to185000 print.jpg 1,060 × 673; 71 KB
-
Vostok co2 temp CO2 415000 yrs print.jpg 1,044 × 868; 106 KB
-
Yamal50.gif 2,480 × 543; 62 KB
-
Yamal50.PNG 1,283 × 270; 46 KB
-
Year2005-us-temperature-graph.gif 650 × 534; 50 KB
-
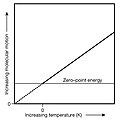
Zero-point energy v.s. motion.jpg 600 × 600; 85 KB
-
Зависимость Энтальпия.jpg 300 × 246; 12 KB
-
Термобар. Ладозьке озеро.PNG 601 × 298; 10 KB


